
By: Albert Jacobs
CliSci # 189 2014-12-20
Mega flares from a Mini star - and a pause for thought
A Red Dwarf type "nearby" star star with planets, possibly in the "habitable zone", has flares that put our Sun to shame. Have a look at this four minute NASA video:
<https://www.youtube.com/watch?feature=player_detailpage&v=hL9OHXw_-A8>
LIMA: 2014 hottest year a manipulation
As part of the Lima propaganda preparation the IPCC has managed to mobilise the world 's media to announce that 2014 would be the hottest year yet. NoTricksZone's Pierre Gosselin has been talking about the "Hottest Year" claim with Harvard Astrophysicist Willie Soon who was getting pretty hot under the collar:
"Is this a joke or simply my BAD dream? Prostituting science like this is now consider a virtue. It is no wonder that science writer Lord Ridley said that he has lost his faith on science as an institution. Why would anyone even bother with claims and insistence of the globe in 2014 being the hottest to a relative colder years all within a few hundredths of a degree Celsius? Poor Anders Celsius should be dancing in his grave.
The claim is based on just one (from a half dozen or so) thermometer-based products whose measurement quality is fraught with uncertainty and with actual error bars at least ten times larger than those claimed effects . WMO and others simply pick and choose the data that produces the press news they want in time for the Lima, Peru political pow-wow.
UNFCCC Executive Secretary Christiana Figueres, a trained economist, and at UNFCCC since 1995, is becoming doubtful of the efficacy of the process of getting her policies approved and seems to be serious in declaring communism best for fighting global warming. She is quoted as saying that democracy is a poor political system for fighting global warming. Communist China, she says, is the best model. Uh,.... China? Whither the UN?
FoS member Dr Glatzle attended Lima 2014 for a local South American agricultural group. He decided to run a little survey to test the factual knowledge of a sampling of delegates. He reports:
Also read Tim Ball on Lima and the UNFCCC 's politics in general.
Pre-historic Warming at the PETM
Nature Geosciences (Dec. 15th) carries a curious paper by geochemist Gabe Bowen and colleagues from the University of Utah, that raises eyebrows. The announcement comes from the university news release and the eyebrows are raised in WUWT.
The authors hold that the rapid temperature increase at the Paleocene-Eocene Thermal Maximum (PETM), some 56 million years ago, can help us in our investigation of modern warm periods.
Curiously, the authors believe that the actual shifts involved two ~1500 year pulses of "carbon" to the atmosphere, that temperatures rose by 5 to 8 degrees Celsius and thereafter "it took almost 200,000 years before things got back to normal". "The new study also ruled as unlikely some theorized causes of the warming episode, including an asteroid impact, slow melting of permafrost, burning of organic-rich soil or drying out of a major seaway. Instead, the findings suggest, in terms of timing, that more likely causes included melting of seafloor methane ices known as clathrates, or volcanism heating organic-rich rocks and releasing methane." Apparently no attempt has been made to tie this major occurrence to any extra-terrestrial events of the orbital or solar-magnetic type. There seems also to be an easy acceptance of a major sudden "carbon" increase in the atmosphere (ignoring that Vostok cores clearly indicate that carbon lags temperature on all time scales). We have not yet seen the actual paper and may report to you on it some time in the future. It seems to us that the authors have not been able to extract themselves from the dogmatic CO2 mechanism.
Says Bowen: "The Paleocene-Eocene thermal maximum has stood out as a striking, but contested, example of how 21st-century-style atmospheric carbon dioxide buildup can affect climate, environments and ecosystems worldwide. [...] This new study tightens the link. Carbon release back then looked a lot like human fossil-fuel emissions today, so we might learn a lot about the future from changes in climate, plants, and animal communities 55.5 million years ago".
.... and more on the Dryas problem
In your editor 's opinion, events like the PETM and the Dryas reversals are of the essence in researching the various causes of changing climates. While the first one occurred in the earlier part of the Tertiary (~60my ago), the latter events associated with the beginning of our interglacial, only 13,000 years ago. While human influence is not a factor in either, changes in CO2 content do occur. Two papers recently appeared, both more technical than is allowed for a brief summary, but let me give you the references and the Abstracts.
* Buizert, C et al - "Greenland temperature response to climate forcing during the last glaciation" Science 345 1177 (2014), DOI: 10.1126/science.1254961.
* Steinthorsdottir, M et al -"Synchronous records of pCO 2 and ˆ†14C suggest rapid, ocean-derived pCO 2 fluctuations at the onset of Younger Dryas" Quaternary Science Reviews 99 (2014) p.84-96,
Arctic albedo
At the AGU convention NASA reported on carbon soot on Arctic ice being measured by satellites. The change in albedo affects in particular NH summer temperatures, but is also blamed for a decrease in Arctic ice coverage and thickness. (I thought it was recovering ....) None of this is new, but the quantitative element in the observations probably is. Mind you, this is "carbon ', really, and may in fact be more important than CO2 (oh, heresy).
Pembina Institute in the cross-hairs
The Alberta coal industry and the electric power plants that use its feed are among the cleanest one can find. The green Pembina Institute does not like black coal, wants to shut down the province 's coal-fed power plants and start using natural gas for power generation. Friends of Science accuses Pembina of exaggeration, omissions, misstatements of key arguments and fear mongering in their report: "A costly diagnosis: Subsidizing coal power with Albertans ' Health".
In the FoS article in Newswire distribution, the Society demands that Pembina formally withdraw the report, alleging that empirical evidence does not support the claims therein and that it is causing undue public alarm.
->This may be last CliSci this year, unless something momentous comes along<-
In the spirit of "IT 'S THE SUN" I wish my readers a HAPPY SOLSTICE, which this year is tomorrow, December 21st, at 23:03 UTC. May the Sun shine favourably on all of you in 2015.
Albert
CliSci # 188 2014-12-10
The boy who cried "Wolf!!"
In NoTricksZone, Pierre Gosselin reviews an article on Payback for blind climate alarmism: Media interest in the latest IPCC Report is small (in German) by "Kalte Sonne" scientists Vahrenholt and L ¼ning about how the German population is getting finally turned off by alarmism. Partially because of larger hazards than warming - like Putin - partially, because the warming is not happening. This is particularly of interest in Germany where the electric utility E.ON is said to be aiming at becoming 100% dependent on alternate energy sources and where energy costs are still rising, and the government is withdrawing from its 2020 climate goals, and a UK paper reports that "its flagship green energy policy is in tatters".
Manufacturing industries are locating outside the EU. The German Climate Consortium reports also that public and media interest in the IPCC 's AR5 was very weak in comparison to previous AR releases. As Germany remains the kingpin of European "action on Climate Change", its developments warrant watching.
Mme Merkel acts the Sphinx.
Counting Polar Bears - a serious research failure
We have all heard about about the disappearing polar bears, due to supposedly decreasing ice cover in the Arctic. In 2006 Dr Mitch Taylor wrote a 12 page review document for the US Fish and Wildlife Service stating that based on his experience as man-on-the-job (he was wildlife manager for the Nunavut government) the statements by that Service were following Greenpeace and Centre of Biological Diversity pressure based on faulty climate change assumptions, urging that the bear population should be put on the Endangered Species list. Taylor presented counts of various polar bear populations to disprove the unsupported allegations, but the myth persisted. In spite of the fact that populations have steadily increased since 2008 the myth miraculously persists to this day and is still being milked by the media.
In a WUWT post Jim Steele (San Francisco State U) investigates why the figures from the USGS models used by the USFWS differ so much from the numbers of the Nunavut government and from the Inuit claims, asking the Question: "Are Polar Bear researchers blinded by Belief or acting Dishonestly?".
This post is an interesting analysis of an example of the failure of the scientific process. (And for something similar look at this one from Peru via the Hopkins and Bloomberg School of Medicine.)
For the record
"The EU 's unilateral climate policy is absurd: first consumers are forced to pay ever increasing subsidies for costly wind and solar energy; secondly they are asked to subsidize nuclear energy too; then, thirdly, they are forced to pay increasingly uneconomic coal and gas plants to back up power needed by intermittent wind and solar energy; fourthly, consumers are additionally hit by multi-billion subsidies that become necessary to upgrade the national grids; fifthly, the cost of power is made even more expensive by adding a unilateral Emissions Trading Scheme. Finally, because Europe has created such a foolish scheme that is crippling its heavy industries, consumers are forced to pay even more billions in subsidizing almost the entire manufacturing sector."
Benny Peiser, Testimony to the US Senate Committee on Environment & Public Works, 2 December 2014
Venus and strong Perigean Spring Tides
Ian Wilson, whose specialty lies with planetary orbits and their influence on other bodies in the solar system has a new paper in Pattern Recognition in Physics entitled "Are the strongest lunar perigean spring tides commensurate with the transit cycle of Venus?".
He finds that whenever the pentagonal pattern for the inferior conjunctions of Venus and the Earth drifts through one of the nodes of Venus ' orbit, the 31/62 year perigean spring tidal cycle simultaneously drifts through almost exactly the same days of the Gregorian year, over a period from 1 to 3000 A.D.
See also Tallbloke 's Talkshop.
Global Priorities
It may come as a cold shower to alarmists allover to see this survey of priorities of six million of the world 's population, which appeared in Hilary Ostrov 's blog.
A crisper reproduction is HERE.
Hockey Stick dies a slow death
As if Michael Mann is not being pummelled enough in court by Mark Steyn, his nemesis Steve McIntyre has made some new tree ring-based reconstructions that made the hockey stick disappear. (WUWT)
Then there is the story that the Russians working for Mann and Briffa in the Siberian sample area warned them that the tree ring width was not showing usable data as it was measuring the wrong metric and that they preferred working with the polar timberline.
Mann's CRU colleagues had also warned him about the unreliability of tree rings as Temperature indicators, in connection with precipitation actually being the property measured, (and did Tom Wigley's son's high school project falsify Mann's research?).
In the media world it is the first excited statement that sticks. Any second thoughts, corrections, go to the back pages. So the Hockey Stick still appears as some bloggers ' argument.
"Society News"
Over the past weeks the Friends of Science Society has taken to the road with a couple of electronic billboard messages in six cities across Canada. One said: "The Sun is the main driver of Climate Change. Not you. Not CO2". the other "Global Warming stopped naturally 16+ years ago", complete with - respectively - a spectacular CME and an 18 year temperature graph.
The billboards resulted in many angry Letters-to-the-Editor and Face-book comments from "believers" in the CAGW myth and the campaign received attention well beyond Canada's borders.
In Quebec, were the billboards were en fran §ais, and on display in the Montreal shopping district and along main Highway 40, the strongest reactions were encountered, including attacks by well-known green organisations and by the Sierra group, in all Quebec newspapers and in the social media. The Sierra Club loaded shame on the shoulders of the innocent billboard operator, demanded that the signs be taken down, and organised a write-in complaint campaign to the Quebec Advertising Council, with Sierra submitting a formal complaint, charging the FoS Society with conducting a "disinformation campaign".
It appears that the Sierra crowd only believes in Free Speech for those people that happen to agree with them.
Some counter measures are being taken by the Society.
CliSci # 187 2014-11-30
Nature - The Humanities want to take over
Starting to lose the battle on the science of climate, Castree et al, in a Letter to Nature V.4/12, call for a new social contract for the IPCC "that rethinks global environmental change research". Complaining that Disciplinary bias and organizational structure of the IPCC Working Groups for the Fifth Assessment Report (AR5) tend to inherently divide (rather than couple) natural and human systems. They are also dominated by natural scientists, while the humanities are almost entirely absent, and the participating social scientists are predominantly economists.
The three IPCC Working Groups (WGI=science/nature; WGII=science/society ; and WGIII=economics/policy) do not promote integrative, trans-disciplinary approaches in line with more than a decade of research on coupled natural human systems or social ecological systems.
They are supported by a commentary by Pearson & Schuldt who maintain that "The climate movement is failing to engage a diverse set of stakeholders in efforts to address climate change, and a lack of diversity within the climate community itself may be, in part, to blame. Research-informed solutions are urgently needed to address the problem".
However, Christan Jakob wants to go back to basics. He warns "Climate models have increased in complexity over time as more processes have been included. Now we need to return to the underpinning basics in the models and ensure they are the best they can be."
A critical look at CO2 measurements
Veteran sceptic Vincent Gray in Wellington, NZ has been publishing his NZClimate Truth Newsletter for many years. His 337th issue deals with the history and practice of CO2 level observations, building largely on the work of Ernst-Georg Beck who passed away in 2010.
Much as Jaworowski criticised the ice core measurement of historic CO2 levels for their lack of precision in providing a representative value of a locale, so do the surface measurements by Beck and his successors throw much doubt on such reliability, because the assumption of effective worldwide mixing is a fiction.
About today 's standard location he says: "The region around Mauna Loa includes areas with CO2 emissions, and much of the rest is a sink. It is understandable how difficult it is to get a sufficiently constant sample.
In order to claim that there is such a thing as a background CO2 it has been necessary to ensure that all measurements everywhere in the world are made from samples from over the oceans. Measurements over land surfaces have been comprehensively discouraged.
Yet the greenhouse effect is about emissions, namely contamination . It is crazy, to take all this trouble to make measurements which do not involve the emitted gases themselves, but only a small fraction that is considered to be well-mixed, then to claim that it is these background figures which apply to the entire atmosphere." He closes with the praise of CO2 fertlisation of the biosphere, quoting Randall Donahue in GRL.
Does low solar activity force cold NH winters?
"Tallbloke" publishes his opinion of a paper by Finnish researcher Jarl Ahlbeck that poses: "Future low solar activity periods may cause extremely cold winters in North America, Europe and Russia.". Ahlbeck notes that over the past sixty winters NH temperatures have been strongly dependent on the phase of the North Atlantic Oscillation Index which influences the position of high and low pressure areas at the North Pole. The negative or positive nature of the AO index seems to have a statistical relationship with the Quasi-Biennial Oscillation Index (Stratospheric wind in the tropics). In short, and with an eye on a Dalton or Maunder minimum, negative (easterly) values of the QBO and low solar activity cause a negative Arctic Oscillation index and cold winters in North America, Europe and Russia. During positive (westerly) values of the QBO the relationship reverses.
The Millennium Cycle and the Vostok core.
Zhao and Feng have an article in Atmospheric and Solar-Terrestrial Physics. "Correlation between solar activity and the local temperature of Antarctica during the past 11,000 years", which describes their research over that period of the Vostok ice core.They looked primarily at the sunspot numbers (SSN) and temperature (T)proxies, as well as CO2 and their correlations prior to the 20th century.
They write: "We find that the variations of SSN and T have some common periodicities, such as the 208 yr, 521 yr, and ~1000 yr cycles. The correlations between SSN and T are strong for some intermittent periodicities. However, the wavelet analysis demonstrates that the relative phase relations between them usually do not hold stable except for the millennium-cycle component. The millennial variation of SSN leads that of T by 30 40 years, and the anti-phase relation between them keeps stable nearly over the whole 11,000 years of the past. As a contrast, the correlations between CO2 and T are neither strong nor stable. These results indicate that solar activity might have potential influences on the long-term change of Vostok's local climate during the past 11,000 years before modern industry."
The millennial cycle, known from the Holocene Optimum, the Egyptian Warm Period, the Minoan Warm Period, the Roman Warm Period, the Medieval Warm Period and the current Warm Period, is the most obvious of the cycles observed.
The pay-walled paper is discussed in The Hockey Schtick which concludes by saying the following:
We have thus shown:
- Strong correlation between solar activity and climate over the past 11,000 years of the Holocene
- Strong lack of correlation between CO2 and climate over the past 11,000 years of the Holocene
- Solar activity explains all 6 well-known warming periods that have occurred during the Holocene, including the current warm period
- The 20th century peak in sunspot activity is associated with a 40 year lag in the peak global temperature
What more proof do you need that it's the Sun!
But wait, there's more. Please see the two previous posts (on The Hockey Schtick- afj) demonstrating that the alternate 33C greenhouse effect is due to atmospheric mass/gravity/pressure, not CO2 or water vapor, physical proof & observations that water vapor is a strong negative-feedback cooling agent, and physical proof that CO2 cannot cause any significant global warming. All of the above also strongly suggests the increase in CO2 levels is primarily due to ocean outgassing from warming oceans from the Sun, not from CO2 radiative forcing warming the oceans, and not primarily from man-made CO2 emissions.
CliSci # 186 2014-11-20
Ocean "acidity" - redux
Taro Takahashi and co-authors at Lamont-Doherty Earth Observatory (Columbia University) claim that their new Global ocean maps detail human-caused ocean acidification. They have a paper "Climatological distributions of pH, pCO2, total CO2, alkalinity, and CaCO3 saturation in the global surface ocean, and temporal changes at selected locations" in Marine Chemistry (abstract).
Whatever the merit of the pay-walled paper itself (pH declines by 0.002 per year) most readers will get their hackles rising up when they see that the acidification talk and global maps that accompany the paper are showing ocean pH figures in the range from 7.74 t0 8.40, i.e. entirely in the alkaline portion of the pH range.
Comments one WUWT reader: "These folks need to get off the acid".
Also see "Buffering the oceans" in CliSci # 184.
Khandekar on Monsoon floods
In a paper published by the GWPF Madhav Khandekar examines Floods and droughts in the Indian Monsoon and connects them with large scale ocean/atmosphere cycles such as the El Ni ±o-Southern Oscillation (ENSO) and the equatorial Indian Ocean Dipole (IOD).
The paper examines the history of past floods and droughts, using India 's excellent set of 200 years of monsoon data and documents that such floods and droughts have always occurred in the past with no link to human activity.
Svensmark to address House of Commons
Professor Henrik Svensmark will address the House of Commons on December 3rd to update his audience on the celestial mechanism by which galactic cosmic rays and terrestrial climate change are mediated primarily by variations in the intensity of the solar wind. This celestial mechanism can significantly influence cloudiness and thereby temperatures on Earth.
(GWPF)
Oh well, sorry: This is the UK House of Commons. When may we expect him in Ottawa?
El Ni ±o and the moon
While the main oceanic oscillations of the past 150 years are generally connected to a solar origin and have the regular cyclic appearance of 30 year cool and warm segments, the ENSO system dances to a different drummer. The Ni ±o/Ni ±a twins are periodic but not cyclic; they depend on a creation of a body of warm water in the Western Pacific, presumably kept in that corner by a cooperating East to West equatorial wind and let loose - as if to restore a balance - creating a West to East equatorial current that warms the water of the Peruvian and Chilean coasts. They depend on excessive warming in the West Pacific and on Pacific wind patterns and are hard to predict. Such is the folklore.
Enter Ian Wilson whom the reader may remember from earlier CliSci issues on orbital conjunction of Venus, Earth and Jupiter and the "VEJ jerk", that would be responsible for affecting the sun, even the sun 's magnetic output. I am not going to explain this new post, but will refer you to hypothesis and discussion as it appears on "Tallbloke 's Talkshop" under the title "Evidence that strong El Ni ±o events are triggered by the moon".
Meanwhile in today 's WUWT Bob Tisdale updates us on the current situation: The Australian Bureau of Meteorology has just upgraded the El Ni ±o status from "WATCH" to "ALERT".
CliSci # 185 2014-11-10
Warming and Cloud cover
John McLean (James Cook Un.) has examined the relationship between "Late Twentieth-Century Warming and Variations in Cloud Cover". A PDF of his paper by that title can be downloaded HERE.
It is being discussed on WUWT and Bishop Hill blogs.
ABSTRACT
From 1950 to 1987 a strong relationship existed between the El Nino-Southern Oscillation (ENSO) and HadCRUT4 global average temperature anomaly, interrupted occasionally by volcanic eruptions. After 1987 the relationship diverged, with temperature anomaly increasing more than ex-pected, but was re-established after 1997 at an offset of ~0.48 °C higher. The period of increased warming from 1987 to 1997 loosely coincided with the divergence of the global average temperature anomalies over land, which are derived from observation station recordings, and the global average anomalies in sea surface temperatures. Land-based temperatures averaged 0.04 °C below sea temperatures for the period 1950 to 1987 but after 1997 averaged 0.41 °C above sea temperatures. The increase in the global average temperature anomaly and the divergence of land and sea surface temperatures also coincided with two significant changes in global average cloud cover. Total cloud cover decreased during the period from 1987 to 1997 and, for most of the remainder of the period from 1984 to 2009, decreases in low-level cloud were accompanied by increases in middle and upper level cloud. These changes can be found in both global average cloud cover and in each of the six 30 °C-latitude bands. The impact of these changes in cloud cover can account for the variations in HadCRUT4 global average temperature anomalies and the divergence between land and sea temperatures.
Taking the IPPC Synthesis Report apart
This week stood in the light of the much ballyhooed IPCC Report, almost to the extent of blotting out anything of intrinsic value. There is a crowd that 's got religion and will hear no critical comment. I 've taken just one sample of critical comment from the heartland of AGW compliance: Europe.
In the publication of the European Institute for Climate and Energy, better known as EIKE, veteran climatologist Klaus-Eckhart Puls addresses nine major aspects of the IPCC Synthesis Report and finds that "Not only does it contain major contradictions, simplifications and even falsehoods with respect to the earlier comprehensive partial reports, it is a stark contraction to almost every measurement and trend in nature. This now falls even more prone to alarmist tending media: Indeed while the previous climate reports [The 3 comprehensive reports of 2013/14] for the most part provided the science and the contradictions, the new Synthesis report suppresses most of the scientific findings. ' (Der Spiegel: "With Global Climate, alarmism goes before exactness", also in NoTricksZone)
The main topics:
'Google Translate' does not do justice to Klaus ' German prose, but you 'll get the drift.
A continuing Climate dialogue
In a previous issue (# 183) I brought to your attention the Dutch-based "Climate Dialogue" project which is proceeding on its website. A number of interesting presentations have been made on the solar chapter of the climate-cause question.
Judith Curry gives a rundown HERE
The main page also contains (near the bottom) papers from 2012 and 2013 sessions of the "discussions" on other contentious climate issues.
Cognitive Bias
On Judith Curry 's blog there is also an interesting essay by Peter Rose who examines how cognitive bias (usually over-optimism) colours the work patterns of geoscientists in the E&P part of the oil and gas industry. He sees parallels with the way climate research is being conductedand must be thinking of the models and the "Pause".
However in the industry, the day of reckoning comes early and is measurable and inexcusable to the shareholders. Rose says: "Perhaps petroleum geoscientists can be forgiven for wishing sometimes that their academic colleagues had to function under similar circumstances!"
Inhofe is back
U.S. Senator James Inhofe, the scourge of greenies, and one who has compared the EPA witch the Gestapo, has announced that in a Republican majority Senate he will be back as the Chair of the Environment and Public Works Committee. With President Obama looking for ways to bypass the legislative route by using Executive Orders with the EPA, there should be lots of fireworks to watch in the coming two years.
CliSci # 184 2014-10-30
Buffering the oceans
In a recent discussion in one of the forums about the presumed unnatural solution to the "missing heat" problem, the matter of the supposed acidification of the oceans by added CO2 also came up. Veteran Australian meteorologist William Kininmonth contributed the following explanation of the chemical buffering process of the oceans:
In the oceans, when additional CO2 is dissolved it partially dissociates into bicarbonate and hydrogen ions; the bicarbonate dissociates into carbonate ions and hydrogen ions; the carbonate ions associate with calcium ions to form dissolved calcium carbonate and if the concentration of the latter increases too much then there is precipitation of calcium carbonate. In addition, pH of sea water rises then H2CO3 dissociates to yield H+, thus reversing the trend; if pH drops then H+ complexes with bicarbonate ions to form H2CO3 causing the pH to rise. As a consequence of natural buffering processes the pH of sea water is regulated between limits.
There is also a new paper in 'Climates of the Past' by Ajioka et al dealing with pH changes in a Japanese fresh water lake over the past 280,000 years, which is discussed in WUWT and The Hockey Schtick (Oct 17).
One may have reasons to doubt the value of the comparison between a fresh water lake and the oceans in view of the different conditions of sedimentation and environment.
A climate for the 21st Century
Astrophysicists Silvia Duhau and Kees deJager have been studying the behaviour of phase transitions between the sun's equatorial and polar magnetic fields as key to the identification of Grand Minima, Regular Oscillation Periods and Grand Maxima.
They claim to have found changes to be predictable.
DeJager made a presentation in the Netherlands yesterday in which he provided some updates on earlier papers on the subject, which were mentioned in previous CliSi issues.
While the Maunder Grand Minimum is well bracketed between 1620 and 1740, they map a Regular Oscillation Period until 1920 and the current Grand Maximum from then till 2007.
They think we have now entered a century-long, rather cool, low-sunspot "Regular Oscillation" with short term variations, possibly not unlike the previous one.
We recall that that one contained the Dalton.
The slides of the presentation can be found on DeJager's website where you should go to "Presentations" and look for "Solar activity and Climate"
A publication lies in the future.
Furthering the myth
"EU leaders have reached a landmark deal to cut greenhouse gas emissions by 40% by 2030, compared with 1990 levels. The binding decision (sic) came after heated discussions at a summit in Brussels, as some members had argued that their varied interests should be protected." - Roger Harrabin, BBC News, 24 October 2014
"The EU announcement was reported in the media as if the EU has already adopted these aggressive new CO2 targets. This is however not the case. In reality the EU Commission only proposed a conditional offer as a negotiation card to be played during the 2015 negotiations at the UN climate conference in Paris. In the absence of an international agreement it is very unlikely that the EU will adopt any new unilateral targets. The EU has made it perfectly clear that it is no longer willing to go it alone." --Benny Peiser, Global Warming Poliicy Foundation, 9 February 2014
Hear Benny Peiser's 4 minute comment and this Polish (in English) video (2 minutes.).
A IPCC scientist changes his mind
Professor Mojib Latif has always been a fervent supporter of "the AGW Cause", at one time claiming that his name was "Global Warming" and belittling Vahrenholt and L ¼ning two years ago when they published "Die kalte Sonne".
In a paper from the Kiel Institute, on which he is a co-author, he now sees North Atlantic cooling over the next decade due to natural causes such as the meridional overturning (AMOC), saying:
¢ North Atlantic sea surface temperature exhibits high decadal predictability potential.
¢ Model bias hinders exploiting the decadal predictability potential.
¢ An innovative method was developed to overcome some of the bias problem.
¢ North Atlantic sea surface temperature will stay anomalously warm until about 2030.
- but carefully avoids pointing to any causes for that predictability and - confusing but cautiously - closes with "
The present warm phase of the AMO is predicted to continue until the end of the next decade, but with a negative tendency".
Ah! A Negative tendency to the warm phase.
Pierre Gosselin reports on this in his NoTricksZone blog , where a witty commentator suggests a headline: "
1812, Napoleon retreats from Moscow due to increasing cold weather."
See also
A reverse relationship?
A paper, El Ni ±os more common during Little Ice Age , published today in Geophysical Research Letters finds that El Ni ±os were more common during the frigid Little Ice Age, and conversely, La Ni ±as were more common during the Medieval and Roman Warm Periods. This finding is the opposite to claims by the IPCC and climate alarmists such as Kevin Trenberth that global warming, if it resumes, will make El Ni ±os more frequent.
Length of Day correlates with solar magnetic cycles
Milivoje Vukcevic has a new paper in which he provides evidence for the LOD being concurrent with solar magnetic cycles. The abstract says that a number of factors ranging from global atmospheric and oceans circulation to the plate tectonic movements affects the length of day (LOD) on different time scales. Existence of a coincidental or causal correlation between the solar magnetic oscillations and the secular LOD changes is demonstrated.
More HERE
Tim Ball breaks a lance for magnetism
In a post on WUWT today Dr Tim Ball explains the importance of the role of magnetic forces on weather and climate. That may not be news for the readers of this newsletter, but it still seems to be for many others.
Worth a read if you want to get the full picture and find out how much we do not know.
^^^^^^^^^^^^^^^^^^^^^^^^^^^^^^^^^^^^^^^^^^^^^^^
Nothing in nature is by chance Something appears to be chance only because of our lack of knowledge.
Baruch Spinoza (1632-1677)
CliSci # 183 2014-10-20
Solar UV forcing trumps the GHG 's IR
In an Open Access paper Bob Irvine is comparing the efficacy of GHG and Solar forcings . He observes that most models assume that the Solar forcing is close to Greenhouse forcing in that respect.
Irvine thinks that shortwave solar forcing may be more efficacious in contributing to ocean heat content than a similar change in GHG in the long wave spectrum.
Were this hypothesis found to be correct, then it follows that equilibrium restoration times at the top of the atmosphere are likely to be considerably faster, on average, for a change in GHG forcing than for a similar change in solar forcing.
A crude forcings model has been developed that matches almost perfectly (R2 = 0.89) the NOAA temperature series from 1880 to 2010. This model is compared to and performs much better over this period than the UK Met Office 's (HadGEM2) contribution to the CMIP5 (R2 = 0.16).
The implication is that the efficacy of a GHG forcing is likely to be considerably lower than the efficacy of a similar sized solar forcing.
Following Svensmark 2006
WUWT reports: CERN 's Jasper Kirby explains the function of aerosols to form clouds and the function of clouds to affect the globe 's temperature. This is the second video in a <http://tedxcern.web.cern.ch/> project.
Russian TV: Why there are cold periods
A 50 minute film from Russian National TV (English narration) provides insights in the coming cooling and the Russian take on how cold periods can be caused by a cold fresh water outpouring from Arctic melts after a warm phase, whereby a temporary reversal of the Beaufort Gyre would take place. This would result in a dislocation of the Gulf Stream and oceanic cooling.
Pierre Gosselin 's No Tricks Zone blog contains some correspondence with Dr Proshutinsky (now at Woods Hole) as well as the video, which is also on You Tube . You should read Pierre 's intro first, if you want to save some time by locating essential parts after the initial 20 minutes of the 50 minute total. The first twenty minutes, interesting enough by themselves, discuss mainly the agricultural, biological and medical aspects of a prolonged cold spell.
In my opinion the hypothesis raises as many questions as it supplies answers and you may not necessarily agree with the reasoning.
Surely, what happens to the oceans plays a large role in the planet 's climate. While one type of mechanism is being discussed (not quantitatively), the forces behind the warming/cooling remain largely unmentioned.
However, the video contains many astute observations.
No fury like a Minister scorned
Next week 's UN climate conference, aiming at replacing "Kyoto" with a treaty reducing "carbon emissions" by 2030 to 40% of 1990 levels is running into a strong headwind from several sides. As unanimity is required within the EU, the strongest statement was from Poland where Polish Deputy Prime Minister and Economy Minister Janusz Piechociš„ski believed the plan is suicidal. If this initial proposal will look as it does now, then Poland will have no choice but to veto it ", he said.
In the UK, the Times headlines that "Britain 's Energy Policy Is Insane: That 's The inconvenient Truth"
Prime Minister Cameron had fired his Environment Minister, Owen Paterson, who is now telling anyone who wants to listen that [the Climate Change Act] is the single most regressive policy we have seen in this country since the Sheriff of Nottingham .
He called on the 300-strong Westminster crowd to challenge current group think and stand up to the bullies in the environmental movement ,
called on his own government to drop the 2050 target and to repeal the Climate Change Act,
Then, he tore into Britain 's cross-party consensus on climate change. The real casualties of the West 's green policies aren 't the poor in this country, but in the developing world. Aid money that could be going to tackle malaria or to build a health infrastructure capable of containing ebola often goes to dubious green projects.
(UK press reports - GWPF)
Climate Dialogue
The "Climate Dialogue" website <ClimateDialogue.org> was started in 2012 at the prodding of the Dutch Parliament that wanted a more open discussion of controversial climate questions. Main organisers are the KNMI, the PBL (Ministry of the Environment) and sceptical science writer Marcel Crok.
The first effort dealt with the Arctic Ocean in connection with the claims of near-total ice melt.ll Subsequent discussions involved topics on statistics, regional models, the missing Hot Spot and Climate Sensitity.
I.m.o. the site really found its groove with its current project, the Influence of the Sun on Climate, on which WUWT gives a disappointing report. But then, when it comes to blogs on the Solar Connection, WUWT is not my favourite source.
This new ClimateDialogue project (all in English) is #6. It has gathered an impresssive array of contributors to the discussion; Lockwood, Scafetta, Solheim, Usoskin, Vaquero. It is entitled "What will happen during a new Maunder Minimum" and contains - after a general overview essay - substantial guest blogs by each of the above, dealing not only specifically with the Maunder, but also with general principles, leaving trails of peer-reviewed papers to back them up.
In particular the blogs by Scafetta and Solheim are worth reading, but the essence of the matter of Cause (mentioned in Scafetta 's Conclusion) remains beyond the scope of the Maunder question.
It has always amazed me that relationships like the flow-sheets drafted by M ¶rner (2012, 2013, presented as Solheim 's fig. 8 and 2013 -figs 2, 4, 5, 6 & 11) can be rejected out-of-hand by the IPCC adherents (because it is not quantitative?), while they themselves built a hypothesis on the unproven effect of a trace gas and can coerce the world 's politicians into accepting it as a basis for global energy policy.
Says M ¶rner in the 2013 abstract: ".... there are multiple criteria suggesting that the solar variability is driven by a planetary beat also affecting a number of terrestrial variables: 14C and 10Be production, Earth 's rotation, ocean circulation, paleoclimate, geomagnetism, etc. .....". Most of his papers of the last decade are devoted to this complex relationship.
CliSci # 182 2014-10-10
Atmospheres in the solar system
While the inhabitants of planet Earth are worrying about four molecules of CO2 in ten thousand of atmosphere, the cloud that emerged above the south pole of Saturn's moon Titan in 2012 has been found to consist of hydrogen cyanide particles. This unexpected result prompts fresh thinking about the atmosphere of this satellite.
A letter in Nature 514 by deKok, Teanby, Vinatier et al reads:
Titan 's middle atmosphere is currently experiencing a rapid change of season after northern spring arrived in 2009 (refs 1, 2). A large cloud was observed 3 for the first time above Titan 's southern pole in May 2012, at an altitude of 300 kilometres. A temperature maximum was previously observed there, and condensation was not expected for any of Titan 's atmospheric gases. Here we report that this cloud is composed of micrometre-sized particles of frozen hydrogen cyanide (HCN ice). The presence of HCN particles at this altitude, together with temperature determinations from mid-infrared observations, indicate a dramatic cooling of Titan 's atmosphere inside the winter polar vortex in early 2012. Such cooling is in contrast to previously measured high-altitude warming in the polar vortex 1, and temperatures are a hundred degrees colder than predicted by circulation models4. These results show that post-equinox cooling at the winter pole of Titan is much more efficient than previously thought.
The above reference numbers are live links.
History and Future of the Natural Sciences
Dr Arthur R ¶rsch, Emeritus Professor at Leiden University and a former Vice-President of the TNO, the Netherlands Organisation for Applied Scientific Research, has been rightfully upset about the degradation of practices in research in the natural sciences. He writes:
"Scientific orthodoxy based on the acquired authority of individuals or groups of scientists has seriously hampered the progress of the natural sciences in the past and continues to do so today because of new societal influences, such as directive funding and political interference in the setting of research objectives.
Enhancing the progress of science must continue to be an important priority in order to meet the future needs of mankind, yet priority setting between different branches of research is currently controversial because of political interference and the limited availability of funds. The establishing of research priorities is often hampered by inadequate scientific literacy among policymakers".
"How do we know....?
Why do we believe.....?
What is the evidence for....?"
(A.B. Arons. Achieving Wider Scientific Literacy. )
Much of what is contained in his Essay "The Progress of Science - Past, Present and Future" has been the result of his immersion into Climate Science during his retirement years, where he has become a pillar in the group of Dutch Climate Sceptics. Being an "old school" scientist he feels a trusted foundation is changing to quicksand.
But the miscarriage of the Scientific Method affects us all.
He has been putting his thoughts on this wide subject into several related essays, one of which will be published by Leiden University Academic Press; another is the above title which has just come out in the Open Access Journal "Humanities 2014, 3, pp.442-516" and can be freely downloaded (414 KB) from the Publisher:
http://www.mdpi.com/2076-0787/3/4/442/pdf.
I have had the privilege to have been part of a group that has worked with Arthur on his essay over the past year and I recommend that you read it and that you help in distributing it widely. We realise that not that many scientists will routinely pick up a copy of "Humanities" and the reluctance of publishers in the natural sciences to accept the Essay, fearing political or commercial repercussions, is obviously part of the problem.
Green Arabia
The early movement of our forefathers from Equatorial Africa to Asia has always been a bit of an enigma, as moving through the deserts of the Arabian Pensinsula would have been a hazardous undertaking.
In recent years Archeologists have been finding ever more stone tools in the desert, left behind by hunter-gatherers tens or hundreds of thousands of years ago. Stratigraphic dating in the field assigned various ages to these collections which largely coincided with the interglacial periods between the Pleistocene glaciations.
Geomorphological work with satellites and geological field checks established the existence of a verdant green paleo-Arabia, with lakes and river valleys, most prominent 125,000 years ago, (one orbit eccentricity earlier) during the previous Interglacial. Much of this is contained in an article in ScienceMagazine of August 29th.
Looks like that interglacial may have been warmer than ours.
Climate modeller Mike MacCracken reports the existence of climate models that mapped the effects of the Milankovitch orbital regime, including the northern movement of the Indian monsoon system during interglacials. He also thinks that those models were in existence before the archaeological finds led to the conclusion of a repeatedly Green Arabia.
Aw, It 's so much better if you can leave the axiomatic CO2 out of it!
(h /t Mike MacCracken)
The missing Heat
Just at the time that Trenberth and the warmist community has decided that it is most likely that the "missing heat" of the inevitable effect of increasing CO2 has gone into the ocean 's depth, here comes NASA's JPL to announce that - sorry - it 's not in the ocean depths. A Co-author is quick to assure us that "these findings do not throw suspicion on climate change itself" and that "the sea level is still rising".
Well now, who would have been casting such dispersions??
In anticipation of the major UN effort to create a successor treaty to the Kyoto Protocol, there has been a virtual avalanche of presumptuous scientific, unscientific, popular, irrelevant, alarmist, repetitive and way-out publications and videos to reverse the decreasing public interest in Global Warming after 16+ years of stand-still. It is starting to dominate the media and the blogosphere.
You will be looking in vain for CliSci to keep you abreast of this.
Sorry, Plainly speaking, I can 't be bothered.
CliSci # 181 2014-09-30
Surprise: Hot California not caused by CO2
A paper by Johnstone and Mantua in PNAS (abstract) "Atmospheric controls on NE Pacific temperature variability and change, 1900-2012" comes to the conclusion that virtually all of the roughly 1 degree Celsius average temperature increase in that period could be explained by changes in air circulation.
The PDO plays the major role. - Gosh, who would have known......
It 's a simple story, but the results are very surprising: We do not see a human hand in the warming of the West Coast, said co-author Nate Mantua, with NOAA Fisheries Southwest Fisheries Science Center.
Comments in the Seattle Times and WUWT.
More truth about wind turbines
The offshore Amalia turbine field 23 km out into the North Sea at the latitude of Amsterdam has 60 Vesta turbines of 2 MW each in about 20 metres of water. The Operator 's website gives some details about the operation, but is silent about cost figures.
Also available are data on the Vestas themselves and one can discover the discrepancy between what 's claimed by the operator in metres/second windspeed at which rated capacity is reached and the performance against the 12 point Beaufort wind scale.
Wind turbines of this type usually do not get going until windspeed 5.
The upshot is that the operator 's claim that maximum capacity is already reached by Beaufort 4 is in contrast to the specs of the turbine which does not produce 50% of capacity until windspeed 5 to 6. Maximum capacity is reached at windspeed 7.
For landlubbers ' information, Beaufort 4 is a "moderate breeze", 7 is "near gale" with "rough to very rough" sea state.
(Courtesy Hugo Matthijssen in DDS)
In spite of the economic absurdity of large wind projects, which has been amply documented since the late Hans Halkema published his "Fact & Fiction" of these projects now more than eight years ago, the Dutch government has just announced plans for another three mega "windpark" fields off the Dutch coast. The gravy train obviously left the station some time ago.
Lewis and Curry look at Climate Sensitivity
Nicholas Lewis and Judith Curry have a paper in Climate Dynamics (Sept.2014) that looks at the uncertainties of Climate Sensitivity calculations. Instead of using the global Climate Models, they deal with the uncertainty factors that can be found in the primary parameters used. They report that uncertainty in aerosol forcing is the dominant contribution to the uncertainties in climate sensitivity and climate response ranges.
While the paper is behind Springer 's Pay Wall, the Abstract is HERE and there is a corrected manuscript version
Michaels and Knappenberger follow up:
"Pat and Chip" note in
brings the number of recent low-sensitivity climate publications to 14, by 42 authors from around the world, indeed giving us 14 references.
Most of these sensitivities are a good 40% below the average climate sensitivity of the models used by the U.N. 's Intergovernmental Panel on Climate Change. The temperature rise of 1.64 C for doubling of CO2 is half that of what Mr Obama and the EPA are using to underpin the President 's Executive Action Plan to cut CO2.
A Contortionist 's view of science
Pierre Gosselin (NoTricksZone) points out that the Antarctic Sea Ice area hasn 't been that large for years; He refers to The Cryosphere Today for his chart.
Record sea ice around Antarctica is due to Global Warming, said Catherine Brahic in the New Scientist five years ago. The southern ozone hole was being blamed.
Now Jan Lieser in the New Scientist proclaims that winds are boosted by the warming; they are "pulling cold air onto the sea ice". Hmm.
In this he is joined by Nerilie Abram, who helpfully suggests that the melting of ice on the Antarctic mainland may also be creating more sea ice, by dumping easily frozen fresh water into the ocean. Huh? Surface temperature are rarely above zero Celsius on the Antarctic continent, except for the Peninsula area.
Back to Svensmark
Stanhill et al have a paper in JGR/Atmospheres with the title "The cause of solar dimming and brightening at the Earth's surface during the last half century: Evidence from measurements of sunshine duration" in which they conclude that changes in cloud cover are more significant in solar dimming and brightening than anthropogenic aerosol emissions.
Abstract
Varying Hale cycle length and the LIA
Anthony Watts inadvertently revived a 2009 solar paper in yesterday 's WUWT which was written by a Japanese threesome in the days that the cosmic ray connection was being established on solid grounds (Svensmark 's first results date from around 2006).
While Svensmark dealt primarily with confirming the physical process at the time, Miyahara, Yokoyama and Yamaguchi 's followed with "Influence of the Schwabe/Hale solar cycles on climate change during the Maunder Minimum", and presented it at the 2010 IAU Symposium. Their research goes back to the LIA and farther and examines the solar magnetic field flips of the Hale cycle (which is more than just two Schwabes together) and why it matters in terms of modulating the cosmic ray flow and the concomitant global cloud picture.
As they summarise: "The complex features of solar magnetic and cosmic ray cycles, such as the variable length of the 11-year cycle, the subsequent lengthening/shortening of the 22-year Hale cycle, the amplification of the 22-year cycle in cosmic rays at grand solar minima, may be able to explain some of the complex features of climate change at this time scale."
CliSci # 180 2014-09-20
Ex-Obama science official
Physicist Dr. Steven Koonin was undersecretary for science in the Energy Department during President Barack Obama's first term and is currently director of the Center for Urban Science and Progress at New York University. His previous positions include professor of theoretical physics and provost at Caltech, as well as chief scientist of BP, where his work focused on renewable and low-carbon energy technologies. In an article in the Wall Street Journal "Climate Science is not settled" .
He writes that "We are very far from the knowledge needed to make good climate policy It is a calm dispassionate piece that summarises what 's known and what isn 't, points to uncertainties and concludes that his former bosses in the political/diplomatic field are misrepresenting the state of science.
A case of progressive myopia
As a geologist, I have been conscious of the rhythm naturally built into the geologic time scale. With the exception of a rather long Carboniferous Period of 80 ma (million years), the following Permian, Jurassic, Cretaceous and Tertiary Periods all lasted in the order of 45 to 70 ma. They each had their characteristic complement of circumstances, sedimentation packages, tectonics and paleontology. Although there have been glacial periods throughout the earth ' history, they were variations on a theme.
Coming closer to our present day, we can see undulations more clearly. For good reasons the Tertiary ended after 70 ma, (as if to put a big stop after a rather benign environment) and what followed was called Quaternary Period, starting only about one million years ago. From that point on we put on our egocentric lenses. It was realised that there had been some five successive glaciations until the last one ended 12,000 years ago. Looking no further than the length of their noses, the following 12,000 were looked at as "game over" for the glacial days and a start of the times in which Homo Erectus appropriated the earth. So the million years of glacial times received the name Pleistocene Epoch, and the last 12,000 years became the Holocene Epoch. It could be that in the past the International Commission which lords over stratigraphic name-giving may have looked at the Holocene - from ὅλος [holos, whole or entire] and καινός [(kainos, new], as actually meaning "entirely recent"* and not as just another interglacial period, which had been recognised since Milankovitch, each lasting for some tens of thousands of years. Most likely, we are in the middle of one.
Fair enough. But realise that we are guilty of some egocentricity here.
Now here comes along our pre-occupation with human-generated CO2 and catastrophic global warming. Some in the warmist community, including academics who should know better, want to create a new geologic Epoch, called "Anthropocene", either by getting rid of the Holocene (not a bad idea) and renaming it Anthropocene, or creating a new Anthropocene starting in the year 1900, or other seriously aberrant expressions of self-importance of Homo Sapiens on this 4.5 billion year old planet. This subjective enterprise is in the hands of the "Anthropocene Working Group of the Subcommission on Quaternary Stratigraphy", Zalasiewicz, J., M. et al., 2010. You can read about this in The Hockey Schtick.
We are just a speck in time. The madness of our times may leave an imprint on our civilisation, but not much on the planet 's geology.
Says one comment on WUWT: I think switching to an Anthropocene Epoch at around 1900 would be beneficial to future historians it could mark the end of the Age of Reason.
* (-Wiki)
Roy Spencer on Water Vapour in the Atmosphere
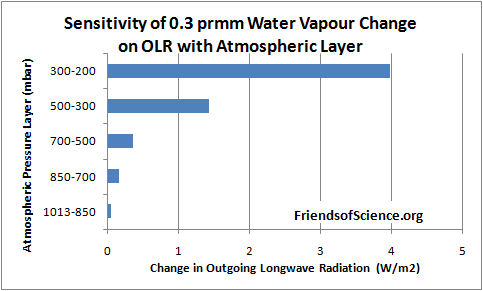
While there is no lack of apologising "warmers" trying in vain to explain the fact that global warming actually stopped some 16 years ago, calling it a "pause"or a "hiatus" (the count of the "excuses" is now in the fifties says WUWT), Dr Roy Spencer has taken a different tack in a post on his website "Water Vapor Feedback and the Global Warming Pause". He explains that decreasing water vapour (and maybe cirrus clouds) in the upper troposphere is increasing the infrared output . Basically, the bottom line is that it 's the processes controlling upper tropospheric water vapour which have the biggest impact on the IR cooling rate of the Earth. He holds that there may well be large increases in lower tropospheric water vapour with 20th century warming, but a small decrease in upper tropospheric vapour can completely negate the resulting water vapour feedback.
On the FoS website, Ken Gregory has some of his favourite graphs that bear on the matter, HERE, HERE, and HERE with the latter one showing that a change of water vapour in the upper troposphere at 200-300 mb pressure levels, about 9 to 12 km altitude, has 81 times the effect of the same water vapour changes in the near surface layer.
Various commentators have expressed their doubts and limitations as well as the matter of the reliability of the Paltridge data that Spencer refers to. Spencer himself reflects how difficult it is to look at the water vapour balance in the general atmosphere from a quantitive point of view.
Roy sets out three possibilities for causes of the "pause": "The three most likely causes of the pause (in my [Roy 's] view, not prioritised) are:
Curiously, though (1) may suggest the Svensmark theory, there is no mention of TSI and solar magnetism changes that many believe to be the causes of cyclic warming and cooling. In that case, the atmospheric and oceanic processes are the agents, implementing the astronomic signal to changes in our climate. Also then, Roy 's paper is not a study of the actual cause(s) and nature of the "pause" (he does not claim it to be) but it suggests that declining upper troposphere water vapor contributes to the "pause" without explaining why the humidity there is declining.
Roy finishes his paper with : "None of the above regarding water vapour feedback is new, and even our 1997 paper examined issues Dick Lindzen was advocating at least a decade before us. I 'm presenting it again to remind ourselves of how little we really know about climate change. And don 't even get me started on cloud feedback."
The Distribution of Water Vapour at 10-12 km Altitude
Almost as a complement to the paper by Roy Spencer, there is a new paper by Andreas Zahn et al in JGR/Atmospheres: Processes controlling water vapor in the upper troposphere / lowermost stratosphere: An analysis of eight years of monthly measurements by the IAGOS-CARIBIC observatory (abstract) as reported in the Hockey Schtick , which proves with measured data that percentages of H2O are quite variable in the upper troposphere and are controlled by three distinctive pathways.
Abstract:
An extensive set of in situ water vapor (H2O) data obtained by the IAGOS-CARIBIC passenger aircraft at 10 12 km altitude over eight years (2005 2013) is analyzed. A multifaceted description of the vertical distribution of H2O from the upper troposphere (UT) via the extra-tropical tropopause mixing layer (exTL) into the lowermost stratosphere (LMS) is given. Compared to longer-lived trace gases, H2O is highly variable in the UT and exTL. It undergoes considerable seasonal variation, with maxima in summer and in phase from the UT up to ~4 km above the tropopause. The transport and dehydration pathways of air starting at the Earth's surface and ending at 10 12 km altitude are reconstructed based upon (i) potential temperature (θ), (ii) relative humidity with respect to ice (RHi), and (iii) back trajectories as a function of altitude relative to the tropopause. RHi of an air mass was found to be primarily determined by its temperature change during recent vertical movement, i.e. cooling during ascent/expansion and warming during descent/compression. The data show with great clarity that H2O and RHi at 10 12 km altitude are controlled by three dominant transport/dehydration pathways: (i) the Hadley circulation, i.e. convective uplift in the tropics and pole-ward directed subsidence drying from the tropical tropopause layer (TTL) with observed RHi down to 2%, (ii) warm conveyor belts and mid-latitude convection transporting moist air into the UT with observed RHi usually above 60%, and (iii) the Brewer-Dobson shallow and deep branches with observed RHi down to 1%.
A new paper published in the Journal of Geophysical Research Atmospheres finds water vapour & relative humidity in the upper troposphere [where the non-existent 'hot spot' is supposed to be] is "primarily determined by its temperature change during recent vertical movement, i.e. cooling during ascent/expansion and warming during descent/compression." [i.e. via the adiabatic lapse rate].
Conventional AGW greenhouse theory assumes, however, that the primary greenhouse gas water vapour is instead controlled by man-made CO2, which allegedly amplifies [via "positive feedback"] the greenhouse effect of CO2 by a factor of 3-5 times. This new paper torpedoes that theory by demonstrating that the natural adiabatic lapse rate [which is dependent only upon atmospheric mass, gravity, and atmospheric heat capacity at constant pressure, and is completely independent of CO2 levels] instead controls the relative humidity/water vapour content of air masses as they rise/expand/cool/dry and then fall/compress/warm in an infinite cycle due to the gravity field.
CliSci # 179 2014-09-10
The Mann-made bespoke smoothing filter
"Jean S" discloses on McIntyre 's Climate Audit" how Michael Mann smoothed and filtered data to produce the Hockey Schtick, a first, as Mann has never before wanted to disclose it himself.
Says Jean: "the main issue here is not which filters/smoothers are appropriate , but the fact Mann was using a method unknown to anyone else. This made it practically impossible to replicate his smoothings, and later, to definitely show beyond the reasonable doubt that he indeed used the trick (i.e., padded with the instrumental data)."
This is a highly technical data processing story. Not being much of an expert in this field, I 'll leave it at that and to the discussion in WUWT. The upshot seems to be that Michael filtered and smoothed until he had the end result he wanted. We knew that, but here 's the proof.
Living in the previous interglacial
A paper by Bakker and Renssen in Climate of the Past, (open access) reported on ln The Hockey Stick and WUWT reviews the extent of the previous interglacial, some 120,000 years ago, and confirms that it was warmer than our current one. Temperatures were up to 8 degrees higher, sea levels were up by 10 to 20 metres, Scandinavia was an island (which is why Lakes Saimaa and Ladoga have ringed seal populations), hippos swam in the Thames at the site of London and raised beaches have been found in Alaska.
Nothing in this is very new, but on the HS site, the comparison of evidence with simulated modelling studies leads to an interesting discussion between an anonymous paleoclimatologist and an anonymous modeller.
How to pick your proxy
Scientists at the Niels Bohr Institute were not happy with the behaviour of CO2 versus Temperature as observed in ice cores during the relatively rapid B ¸lling/Aller ¸d and Younger Dryas major climate changes, which indicated non-expected (by them) results of temperatures climbing first followed by CO2. Not happy with O18 as a proxy, Gkinis and Vinther tried N14/15 and got the results they wanted.
"What we discovered was that the previous temperature curve, which was only based on the measurements of the oxygen isotope O18, was inaccurate. The oxygen temperature curve said that the climate in central Greenland was colder around 12,000 years ago than around 15,000 years ago, despite the fact that two key climate drivers carbon dioxide in the atmosphere and solar radiation would suggest the opposite. With our new, more direct reconstruction, we have been able to show that the climate in central Greenland was actually warmer around 12,000 years ago compared to 15,000 years ago. So the temperatures actually follow the solar radiation and the amount of carbon dioxide in the atmosphere. We estimate that the temperature difference was 2-6 degrees," says Bo Vinther.
This sort of science did not sit well with their critics and in the discussion more interesting facts come to light on these deep climate flips. Milankovitch, the thermohaline circulation, snow accumulation, Svensmark, solar variability effects, initial and threshold states of the climate.
The study appeared in Science magazine.
Prepare for the Climate Summit 2014
UNEP and the WMO want you to get in the mood for their September 23rd meeting that will save their skin.
Obama, Kerry and Clinton travel the world promoting the New York attempt to reach a Kyoto-type follow-up agreement.
China and India will not take part, Merkel isn 't coming and EU President Tusk is pushing Coal.
A one minute teaser of a disaster movie made to encourage you is so bad that it may well be counterproductive . You find it on a WUWT post
There is an international schedule of such fantasy disaster weather forecasts.
About Face !
A new book: "About Face! Why the World Needs More Carbon Dioxide; The Failed Science of Global Warming" has come out from the hand of the late economist Arthur Middleton Hughes (US) who passed away shortly before publication, Meteorologist Madhav Khandekar (Canada) and Em. Professor Cliff Ollier (Australia). It deals with public misconceptions such as:
1) that DDT is dangerous to human life and should not be used to eradicate malaria,
2) that making ethanol out of corn will help make America independent of the Arab states in energy and
3) that carbon dioxide is warming the earth and could lead to a dangerous overheating which could end life on our planet. All three are wrong and have led to billions of wasted dollars and millions of deaths worldwide.
It lauds the benefits of CO2 as an enhancer of food supply and condemns ethanol production from food stuffs.
Dr Khandekar, a retired Environment Canada researcher, is a long time advisor of the Friends of Science Society. He has written extensively about "Extreme Weather" and is a contributor to the independent NIPCC panel reports.
Prof. Ollier, an earth scientist, has written about "Lysenkoism and Global Warming". He has also been a contributing author for the NIPCC reports.
Arrhenius 1906
Svante Arrhenius wrote in 1896 his 40 page paper "On the influence of Carbonic Acid in the Air upon the temperature of the ground", originally in German and published by the Stockholm Academy of Science. In it he outlined the relationship between CO2 and Temperature in light of the cold Dalton Period, the last segment of the Little Ice Age which was still in living memory. AGW adherents often refer to this paper as the basis for the AGW theory. It was not the only paper he devoted to the subject and one follow-up he wrote ten years later stands out.
In 1906 he wrote about the reactions to his numbers by a number of colleagues, some of which (like …ngstr ¶m) disagreed sharply. "Die vermutliche Ursache der Klimaschwankungen describes some of the disagreements and recalculates the climate sensitivity proposed in 1896, discusses the influence of water vapour and the experiments conducted and lowered his value of the climate sensitivity of ten years earlier.
The 1906 paper is also significant as a historic document. In the last two pages it explores the old idea that the Ice Ages were explained by strong shifts of the poles on the Earth 's surface. Arrhenius says this is "extremely unlikely". This is typical of the discussion in the era prior to Wegener's concepts of continental drift.
The IPCC has not referenced the 1906 paper. The Friends of Science Society has obtained a scanned copy of the German original and translated it into English. "The Presumed Cause of Climate Fluctuations" can be found on its website under "FoS Initiatives", together with the scanned German original.
Those of you interested in more science history from those days should download Arrhenius ' 229 page "Worlds in the Making" 1908.
A WMO counter-offensive
A report issued yesterday by one of the IPCC 's "parents", the World Meteorological Organisation, makes seven claims in support of continuing global warming (even if we can 't measure it), six of which are debunked by the Hockey Schtick. What about number seven?
Here 's HS ' comment:
"'7. They did get one thing right however, admitting "It is high time the ocean, as the primary driver of the planet's climate and attenuator of climate change, becomes a central part of climate change discussions"
That's right, the Sun heats the ocean, the Sun and possibly lunar tidal forcing drive ocean oscillations, ocean oscillations then drive global surface temperatures, not greenhouse gases. Longwave IR from greenhouse gases cannot penetrate or heat the oceans, and warming of the atmosphere cannot heat the oceans because heat rises and the oceans have 1000 times greater heat capacity than the atmosphere. Game over. "
CliSci # 178 2014-08-30
"Carbon Tet" and the ozone layer; 25 years later
Whatever one may choose to believe about the causes promoted by the 1987 Montreal Protocol that restricted the use and production of chlorinated (fluoro/hydro-) carbons to protect the ozone layer, it has not solved the presumed problem. According to NASA, that forbidden wonderful spot remover "Carbon Tet" (CCl4) is still in the atmosphere and continues to be emitted. Over time, the ozone hole keeps varying, but it has not disappeared.
NASA/Goddard's Qing Liang speculates on unidentified industrial leakages, large emissions from contaminated sites, or unknown CCl4 sources, but she has no answers.
But lots of discussions and some answers come in the WUWT post's comments section from a variety of readers, mostly from a scientific angle, but also some from readers who recall that the Montreal Protocol left a bad taste in their mouths.
Some items:
Waking up and smelling the coffee.
In Nature Geoscience magazine Adolphi, Muscheler et al have found a "Persistent link between solar activity and Greenland climate during the last glacial Maximum" (abstract). Their extensive reference list (30 titles) suggests that the ten co-authors have not paid much attention to the published work of sceptical researchers of decades past. Nevertheless, the topic gets needed attention.
Now, this is not particularly earth-shaking, but one may ask why a solar-connected climate paper does not get printed in Nature Climate Change, where it could open some warmist eyes? Your editor received a year 's subscription to that Nature specialty mag and found it nauseatingly politically correct.
Arctic Sea Ice
This second part (1920-1940) in a series which analyses historic variations in Arctic sea ice cover over the past two centuries uses multiple sources to firm up a body of fragmentary and anecdotal evidence and is posted on WUWT. The study recognises several periods of Arctic Warming and tries to justify estimates with the more recent satellite record. Reports of warm water ingress and the part the transpolar drift stream played in removing ice are noted.
The summary states also that "Arctic warming appears to be part of a much more general warming of the world during the period which does not seem to be fully represented in the global temperatures data."
The report does not deal with interpretation of causes.
About "missing Heat hiding in the Oceans"
In WUWT, David Archibald attacks the widely distributed excuse that the "Pause" only means that the heat is somehow hiding in the oceans. "Oceans don 't work like that". In particular he aims at Xianyao 's article and Kintisch' paper in ScienceMag of August 22nd.
Glacier formation in .... Scotland
Hazards common in arctic and alpine areas but described as extremely unusual in the UK during the summer have been found on Ben Nevis.
A team of climbers and scientists investigating the mountain 's North Face said snowfields remained in many gullies and upper scree slopes. On these fields, they have come across compacted, dense, ice hard snow call neve. Neve is the first stage in the formation of glaciers, the team said.
The team has also encountered sheets of snow weighing hundreds of tonnes and tunnels and fissures known as bergschrunds.
Antarctic freeze-up.
As Pierre Gosseling points out on his blog :
Nowhere have records been falling faster than in Antarctica. And what is shocking is that these records are all tied to cooling and not warming.
Antarctica has been setting new maximum sea ice records almost daily, and never has Antarctic sea ice been so high for so long since satellite measurements began some 35 years ago. Sea ice anomaly has averaged over 1 million square kilometres for over one year. Take a look at his illustrations.
Power of the sun
For something entirely different: In Nature 512 of 28 August, a large group of solar physicists (the Borexino collaboration) has published their results of the goings-on in the interior of the sun, the power station that drives us all.
Abstract:
In the core of the Sun, energy is released through sequences of nuclear reactions that convert hydrogen into helium. The primary reaction is thought to be the fusion of two protons with the emission of a low-energy neutrino. These so-called pp neutrinos constitute nearly the entirety of the solar neutrino flux, vastly outnumbering those emitted in the reactions that follow. Although solar neutrinos from secondary processes have been observed, proving the nuclear origin of the Sun 's energy and contributing to the discovery of neutrino oscillations, those from proton proton fusion have hitherto eluded direct detection. Here we report spectral observations of pp neutrinos, demonstrating that about 99 per cent of the power of the Sun, 3.84 — 1033 ergs per second, is generated by the proton proton fusion process.
(h/t Oliver Manuel)
The Younger Dryas Event
A group with UCSB Professor James Kennett (Kinzie et al) has published a paper in the Journal of Geology reporting that a NH distribution of a nanodiamond-rich layer is consistent with major cosmic impact at the boundary of the Younger Dryas Event, 12,800 years ago.
Abstract:
A major cosmic-impact event has been proposed at the onset of the Younger Dryas (YD) cooling episode at ‰ˆ12,800 ± 150 years before present, forming the YD Boundary (YDB) layer, distributed over >50 million km2 on four continents. In 24 dated stratigraphic sections in 10 countries of the Northern Hemisphere, the YDB layer contains a clearly defined abundance peak in nanodiamonds (NDs), a major cosmic-impact proxy. Observed ND polytypes include cubic diamonds, lonsdaleite-like crystals, and diamond-like carbon nanoparticles, called n-diamond and i-carbon. The ND abundances in bulk YDB sediments ranged up to ‰ˆ500 ppb (mean: 200 ppb) and that in carbon spherules up to ‰ˆ3700 ppb (mean: ‰ˆ750 ppb); 138 of 205 sediment samples (67%) contained no detectable NDs. Isotopic evidence indicates that YDB NDs were produced from terrestrial carbon, as with other impact diamonds, and were not derived from the impactor itself. The YDB layer is also marked by abundance peaks in other impact-related proxies, including cosmic-impact spherules, carbon spherules (some containing NDs), iridium, osmium, platinum, charcoal, aciniform carbon (soot), and high-temperature melt-glass. This contribution reviews the debate about the presence, abundance, and origin of the concentration peak in YDB NDs. We describe an updated protocol for the extraction and concentration of NDs from sediment, carbon spherules, and ice, and we describe the basis for identification and classification of YDB ND polytypes, using nine analytical approaches. The large body of evidence now obtained about YDB NDs is strongly consistent with an origin by cosmic impact at ‰ˆ12,800 cal BP and is inconsistent with formation of YDB NDs by natural terrestrial processes, including wildfires, anthropogenesis, and/or influx of cosmic dust.
CliSci # 177 2014-08-20
Abrupt Climate Change (2)
Under this title CliSci # 172 (June 30th) reported on climate changes of the Dansgaard/Oeschger (D-O) type 1200-1500 year cycles as being related to a major periodic collapses ' of sea ice cover, caused by warm subsurface waters. Peterson 's explanation had something of a chicken-and-egg nature, apparently careful not to include an external cyclic mechanism.
Then in CliSci # 175 (July 30th) under "The sudden end of the last glaciation" we mentioned work on Alaska sediments by Praetorius and Mix pointing to a synchronisation of Atlantic and Pacific cyclic system for rapid climate change. And it was left to Tallbloke 's Workshop to introduce the sun and Milankovitch into the comments.
While both papers deal with climate changes in distant past, one should welcome the increased attention that is being given to climate changes that are obviously not related to AGW, if only to attempt to zero in on the real cause(s).
A third paper has now appeared in Nature by Xu Zhang et al "Abrupt glacial climate shifts controlled by ice sheet changes". Though pay-walled, it has a reasonable length Abstract.
But the writers can not manage to abandon CO2. They are again looking to the secondary expressions of the Northern Hemispheric Ice Sheets to alter the coupled atmosphere-ocean system which would closely resemble D-O events and put their computer simulations to work: "The simulated global climate responses including abrupt warming in the North Atlantic, a northward shift of the tropical rainbelts, and Southern Hemisphere cooling related to the bipolar seesaw are generally consistent with empirical evidence. As a result of the coexistence of two glacial ocean circulation states at intermediate heights of the ice sheets, minor changes in the height of the NHISs and the amount of atmospheric CO2 can trigger the rapid climate transitions via a local positive atmosphere ocean sea-ice feedback in the North Atlantic."
It is apt to note that their long 99 item reference list does not appear to include more than a couple of solar or orbital references. I.m.o. they fail to recognise that in concentrating on the atmosphere/oceans, the thermo-haline currents and the ice build-up, they are concentrating on what actually is the secondary event: the implementation mechanism of climate change. Not on the cause(s). Therefore their title is misleading and the work is not predictive.
The "Normal" has become "Abnormal"
It is something I have heard Tim Ball say for years. In an attempt to keep the panic-driven IPCC scenario alive, Greenhouse gases - CO2 most of all - are used to explain our dire future, and historically normal fluctuations are portrayed as abnormal weather.
The interaction in the middle latitudes of the meridional and the latitudinal flows, (producing the jet stream garlands) is assuring us of changing weather patterns and is normal. However a larger flow in the polar vortices produces an increase in cyclonic weather systems at both poles, projected to the lower latitudes in both hemispheres, as Cordoba (Arg)-based Ferreyra has pointed out in past years. Some large garlands can become blocking ridges.
Many have speculated as to the cause this increase, which is rather unlikely to be CO2, but possibly solar related.
Dr Tim Ball wrote several articles about this, among which is this one: "Current global weather patterns normal despite government and media distortions".
The Solar Cycles and our atmospheric changes
Once one recognises the connection between the solar changes and our atmospheric variations, the question becomes one of mechanism. During a solar cycle different measurable expressions vary in different ways: the TSI, the UV radiation, the GCRs and the magnetospheric particles. For example, geomagnetic activity and magnetospheric particle fluxes peak in the declining phase of the sunspot cycle, in difference to TSI and UV radiation which more closely follow sunspots themselves. From what I understand of this, it looks like expressions of the maximum and minimum effect of the two magnetic fields, poloidal and toroidal, of the sun 's dynamo (DeJager&Duhau 2012, Jrnl SWSC)
This is being explored in a paper by Maliniemi et al in JGR (in press) :"Spatial distribution of Northern Hemisphere winter temperatures during different phases of the solar cycle (abstract only), where they find that the clearest expression is found during the declining phase of the sunspot maximum in the positive phase of the North Atlantic Oscillation, the NAO.
The Malinieme paper is discussed in The Hockey Schtick
A Solar Bibliography
One of the neatest and most useful collections of recent papers on the Solar connection to climate is kept by the "Club du Soleil", which you can find at
It is hereby helpfully presented to Naomi Oreskes for broadening her mind.
Devout Swiss Warming scientist makes a discovery
Pierre Gosselin reports in NoTricksZone that devout warming scientist Professor Reto Knutti of the Z ¼rich ETH insists global warming has only paused and will continue in the near future:
"Climate warming continues, but it 's taking a break. The reasons for that, among others, are the temporary weak solar irradiance and phenomena such as La Ni ±a.
The tone of the article is one of shaking a finger at the incorrigible, irresponsible and manipulative climate sceptics and advising readers to not stop being afraid and to never ever believe those sceptics. Professor Knutti 's writes that multiple possible reasons have been systematically investigated for the first time. This all new litany of excuses they present includes:
* aerosols (of course)
* La Ni ±a
* weaker solar radiation
* low sunspot number
* volcano eruptions
* inadequate, unreliable temperature measurement methodology!
That 's right, says Pierre, all the factors that they stupidly refused to adequately incorporate in their models, despite being told time and again by sceptics not to neglect them. Their panic is truly palpable, at least in Switzerland. Knutti and his fellow warmists are so antsy about rescuing their warming that he is now actively hinting at making up temperature data. See more HERE . Not much credibility left in that Warmist. I used to have great respect for the ETH, one of the best science and engineering schools in the world.
LATE NEWS: In today 's WUWT: A quote from a just published ETH post: "If the model data is corrected downwards, as suggested by the ETH researchers, and the measurement data is corrected upwards, as suggested by the British and Canadian researchers, then the model and actual observations are very similar." Let 's hope they are just joking.
Polls; do you believe in polls?
Polls are not something I usually spend any time on. The questions posed are usually ambiguous, leading or irrelevant, the sample coverage of "polled" citizens so slanted that the results are questionable. However, I do accept that multiple polls ten years ago concluded that 70 to 80% of the population believed that CAGW was very likely and that "Kyoto" was a necessity. That 's when some colleagues and I concluded that the science facts of the matter needed some discussion. We founded the Friends of Science Society.
Public sentiment in the matter has changed. May-be it was the EPA 's radical power grab in US coal country, but it moved the Pittsburgh Post-Gazette to contract iMediaEthics for a nation-wide survey to what degree the so-called 'scientific consensus' has affected public opinion. The Agency 's director, David Moore, while also offering in an essay his own opinion on the flaws of other surveys, presented his results and a clear methodology statement in the August 10th Post-Gazette summarising: Just 41 percent of Americans are confident that most scientists agree that climate change is happening now caused mainly by human activities, ' while 18 percent firmly believe there is little agreement among scientists ' on the issue and the rest are unsure.
The sample may not have been large, but the signal is clear. Popular CAGW support may now be almost half of what it used to be.
CliSci # 176 2014-08-10
Excuses, excuses.....
The Hockey Schtick and Anthony Watts have taken up the sport of reporting the number of excuses Warmists have proposed to deal with the now 16+ years of Global Warming interruption (if "interruption" is what it is). Anthony reports that A few days ago he was up to 29, but now the thirtieth has shown up. Two different press releases cover this additional paper, one from Hawaii, the other from NSW, with differences in emphasis. They blame Pacific Trade winds for disrupting Atlantic Warming, and causing cold upwellings. The occurrence of cycles does not seem to have been considered.
Grasping at straws.
And the Australian Climatescepticsparty blog presents a list of "Quotable Warming Hiatus Quotes".
A Gleissberg Minimum?
In a recent paper "The Centennial Gleissberg Cycle and its Association with Extended Minima", to be soon published in JGR/Space, Feynman and Ruzmaikin discuss how the recent extended minimum of solar and geomagnetic variability (XSM) mirrors the XSMs in the 19th and 20th centuries: 1810 1830 and 1900 1910.
Edited abstract:
Such extended minima also were evident in aurorae reported from 450 AD to 1450 AD. The paper argues that these minima are consistent with minima of the Centennial Gleissberg Cycles (CGC), a 90 100 year variation observed on the Sun, in the solar wind, at the Earth and throughout the Heliosphere. The occurrence of the recent XSM is consistent with the existence of the CGC as a quasi-periodic variation of the solar dynamo. Evidence of CGC's is provided by the multi-century sunspot record, by the almost 150-year record of indexes of geomagnetic activity (1868-present), by 1,000 years of observations of aurorae (from 450 to 1450 AD) and millennial records of radionuclides in ice cores. The "aa" index of geomagnetic activity carries information about the two components of the solar magnetic field (toroidal and poloidal), one driven by flares and CMEs (related to the toroidal field), the other driven by co-rotating interaction regions in the solar wind (related to the poloidal field). These two components systematically vary in their intensity and relative phase giving us information about centennial changes of the sources of solar dynamo during the recent CGC over the last century. The dipole and quadrupole modes of the solar magnetic field changed in relative amplitude and phase; the quadrupole mode became more important as the XSM was approached. Some implications for the solar dynamo theory are discussed.
* Says The Hockey Schtick: If it is true that the current lull in solar activity is "consistent with minima of the Centennial Gleissberg Cycles," and the Gleissberg Cycle is a real solar cycle, the current Gleissberg minimum could last a few decades before solar activity begins to rise again.
* Solar physicist Habibullo Abdussamatov predicts the current lull in solar activity will continue until about the middle of the 21st century and lead to a new Little Ice Age within the next 30 years.
[See NOAA end-of-July solar graphs here]
A closer look at Maxima and Minima
Finnish solar physicist Ilya Susoskin and co-authors have written a letter in Astronomy&Astrophysics 562, entitled "Evidence for distinct modes of solar activity", in which they present the first adjustment-free physical solar reconstruction over the past 3,000 years.
The authors used 14C readings, providing sunspot number and Cosmic Ray modulation potential at a decadal resolution with 95% confidence. Data are avalable HERE .
The best review of this work is to be found on the Idso family 's "CO2 Science" website, which in its inimitable way reports on "What was done", "What was learned", "What it means".
In essence, Susoskin et al mapped solar magnetic variations in great detail over three millennia, which allowed them to differentiate between three main modes: Maxima, Regular and Minima. The solar maximum of recent Solar Cycles 19-23 is classified as "a rare or even unique event, in both magnitude and duration, in the past three millennia." It will be interesting to see the influence that this study will have on the solar dynamo models.
The Idso's wag a finger at the IPCC scientists who never spent much time investigating the 1950-2009 Maximum in context. But then, anything but human-caused warming was never on the Panel 's job ticket.
Also - and with comment - in WUWT
Trends in downwelling IR radiance
Anthony Watts dug up a 2011 article that Gero and Turner wrote on this subject in AMS Journal 24/18 which found a reduction of IR radiation during most of the first fourteen years of the present so-called "pause", a period during which atmospheric CO2-content increased as usual. The authors state that the "Interferometer data record demonstrates that the downwelling infrared radiance is decreasing over this 14-yr period in the winter, summer, and autumn seasons but it is increasing in the spring; these trends are statistically significant and are primarily due to long-term change in the cloudiness above the site" and that "this dataset has high value owing to the ability to infer possible mechanisms for any trends from the observations themselves and to test the performance of climate models".
Concludes Watts: "The findings contradict the main tenet of AGW theory which states increasing greenhouse gases including the primary greenhouse gas water vapour and clouds will cause an increase of downwelling long wave infrared back-radiation.
AGW better detected in the Stratosphere?
Christos Zerefos and eight co-authors have a paper in the European (open access) Atmospheric Chemistry and Physics on "Evidence for an earlier greenhouse cooling effect in the stratosphere before 1980 over the Northern Hemisphere", commented on by WUWT and The Hockey Schtick. The paper claims that the stratosphere cooling is a more suitable signal of anthropogenic global warming (AGW) than the "tropospheric greenhouse warming signal". The troposphere cooled to 1976 then started warming.
FoS' Ken Gregory takes issue with the authors' date chosen to split the trend lines in their summer graph, which should be 1976 instead of 1979, based on the Lower Troposphere's balloon data; it changes the trend slope.
Climate models predict that the mid-troposphere over the tropics would warm twice as fast as the near-surface air, which creates the so called predicted "hot spot". This hot spot is often call a "fingerprint of AGW" but it is really the fingerprint of a predicted positive water vapor feedback. The paper never mentions the hot spot, but "The Hockey Schtick" interpreted the tropospheric signal as the hot spot.
Gregory comments that Table 1 shows the summer 1980 to 2011 trends for the Northern tropics are 0.13 C/decade in the near-surface layer, but only 0.07 C/decade in the mid-troposphere (500 - 300 mbar), so instead of the predicted hot spot, it finds a cold spot. The abstract calls the stratospheric cooling an "early warning signal" of AGW, but cooling of the stratosphere does not imply anything about how much greenhouse gas emissions will affect surface temperatures. We agree with the main-stream explanation of the direct radiative effects of CO2, but not with the troposphere's response to those effects.
The paper concludes that the stratosphere is more suitable than the troposphere for detecting the AGW signal, because the stratosphere is not affected by changes in tropospheric water vapour and clouds. But these changes provide the strong negative feedback in the troposphere, making AGW small and not a problem. Stratospheric cooling only suggests that GHG emissions will have some effect on near-surface climate, but it says nothing about how large that effect will be.
El Ni ±o has been around for 10,000 years
Un. of Montpellier 's Matthieu Carr and co-authors have examined and dated (mostly Peruvian) sea shell deposits to follow El Ni ±o through the millennia and found that the record goes back at least 10K years, through climatological changes that slightly changed its impact. Those changes may correlate with insolation.
Abstract:
Understanding the response of the El Ni ±o-Southern Oscillation (ENSO) to global warming requires quantitative data on ENSO under different climate regimes. Here, we present a reconstruction of ENSO in the eastern tropical Pacific spanning the last 10 thousand years (ka) derived from oxygen isotopes in fossil mollusk shells from Peru. We find that ENSO variance was close to the modern level in the early Holocene and severely damped ~4-5 ka. In addition, ENSO variability was skewed toward cold events along coastal Peru 6.7-7.5 ka owing to a shift of warm anomalies toward the Central Pacific. The modern ENSO regime was established ~3-4.5 ka. We conclude that ENSO was sensitive to changes in climate boundary conditions during the Holocene, including, but not limited to insolation.
A summary by Hanna Hickey (U.Wash.) appears in WUWT followed by the usual ENSO discussions, in which one commentator (Bill Illis) clears the air by stating: "The requirements for an ENSO are a wide deep ocean at the equator, a rotating Earth, and Trade Winds. That makes for an ENSO operating for about 80% of Earth history."
CliSci # 175 2014-07-30
The sudden end of the last glaciation
Researchers at Oregon State U., examined Alaska sediment cores from around the time of the end of the last Ice Age, to come to the conclusion that a relatively modest warming was suddenly accelerated by the synchronisation of the North Atlantic and North Pacific cyclic systems leading to a tipping point (not my words) for the melting of the Northern and Southern ice sheets (Science, July 25).
Tallbloke wonders whether the Milankovitch Precession cycle might be involved and generates lots of comments.
Whence the CO2?
A paper by a group from three Dutch universities published in Atmospheric Chemistry and Physics that they have found that only about 3.75% [15 ppm] of the CO2 in the lower atmosphere is man-made from the burning of fossil fuels, and thus, the vast remainder of the 400 ppm atmospheric CO2 is from land-use changes and natural sources such as ocean outgassing and plant respiration.
Interview with Sebastian L ¼ning
Geologist Dr L ¼ning is interviewed by The New American with a 15 minute video, filmed at the Heartland conference.
Pierre Gosselin (NoTricksZone) summarises.
The missing Heat
The missing heat is somewhat like the Scarlet Pimpernel.
While McGill U 's Shaun Lovejoy ("Return periods 0f global climate fluctuations and the pause") "discovers" the influence of natural variability he doesn't really come to grips of the ~60 year oceanic cycle and its connections.
Trenberth thought he found the Pimpernel hiding in the deep oceans. One does indeed need some fiction to imagine surface warm water to stay hidden near the near freezing depths and an inventive mechanism to get it down there. "The Team" has the need to explain the 16 year lack of warming and finds that it runs into more questions than answers.
Jim Steele reports in Landscapes and Cycles that the deep oceans are cooling and refers to work by Wunsch and Heimbach (in pre-print HERE).
The result is a good assessment of the state of knowledge of the deeper oceans, which - it is agreed - is still severely lacking both qualitatively and quantitatively. But there is no support for Trenberth 's proposed solution.
Winning the science battle, but losing the policy war
At the ICCC9 conference Dr Tim Ball gave a lecture on public understanding of the climate issue. He has fleshed this out and published it as a monograph on his website.
There also is a worthwhile very short video summary of ICCC9 (<5 min.)
The tropical Troposphere, models vs observations
Ross Mc Kitrick and Tim Vogelsang have a new paper comparing climate models and observations over a 55-year span (1958-2012) in the tropical troposphere. Among other things they show that climate models are inconsistent with the HadAT, RICH and RAOBCORE weather balloon series. The models not only predict far too much warming, but they potentially get the nature of the change wrong. The models portray a relatively smooth upward trend over the whole span, while the data exhibit a single jump in the late 1970s, with no statistically significant trend either side.
"HAC robust trend comparisons among climate series with possible level shifts" is downloadable as open access from Envirometrics through Wiley 's online library.
CliSci # 174 2014-07-20
The Carbon Cycle, quantitatively
While so many sceptical atmospheric physicists are convinced that CO2 is not an agent that contributes to Global Warming in any substantial way, the actual inventory balance and the exchanges between atmosphere, biota, soil, and the oceans in that temperature driven balance are still unsettled matters.
Watts' Guest Blogger, Ronald Voisin takes a good stab at it in "What an Engineer finds Extraordinary about Climate" and causes immediate reaction from a knowledgeable crowd, which includes Ferdinand Englebeen and Richard Courtney.
This one is for aficionados only.
NOAA data challenge IPCC claim of Sea Level rate of increase
The UN IPCC AR5 WG1 report claims that:
It is very likely that the mean rate of global averaged sea level rise was 1.7 [1.5 to 1.9] mm yr 1 between 1901 and 2010, 2.0 [1.7 to 2.3] mm yr 1 between 1971 and 2010, and 3.2 [2.8 to 3.6] mm yr 1 between 1993 and 2010. Tide-gauge and satellite altimeter data are consistent regarding the higher rate of the latter period. It is likely that similarly high rates occurred between 1920 and 1950.
[But] the latest mean sea level rise trend data from NOAA simply does not support IPCC assertions that mean sea level rise trends are increasing since 1971.
The IPCC report discusses the fact that individual location tide gauge measurement values can vary significantly from global average values generally because of the consequences of location specific topography and geology-related impacts.
But what the UN IPCC AR5 WG1 report completely fails to address is the fact that the long duration period NOAA mean sea level trend data behaviour represent constant and unchanging linear records over time which present major challenges to IPCC claims of increasing sea level rise rates since 1971. The NOAA data is simply unsupportive of IPCC claims of increasing rates of sea level rise in recent decades.
Furthermore Larry Hamlin states in WUWT that the unchanging and constant linear NOAA mean sea level trend records from worldwide tide gauge station data versus the UN claims of increasing rates of sea level rise based on satellite sea level data, suggest that the latter outcome is "driven by anomalous analytical artifacts associated with the measurement and measurement analysis methodology not reflective of real world outcomes".
An interesting graph (Fig 11b) illustrating the slope difference between tidal gauge and satellite rate trend appears in Klaus Puls' paper on Sea Level Increase Rates which can be downloaded from <https://dl.dropboxusercontent.com/u/59135553/Puls-.Meeresspiegel%20Anstieg.pdf>
9th International Conference on Climate Change
ICCC-9, <http://climateconference.heartland.org/> (Las Vegas, July 7-9, 2014) may not have broken much new ground, but was labelled a great success by those who attended.
While the proceedings can be followed through video files on the Heartland Foundation's website some highlights are worth mentioning and various blogs have had a go at it. Comments and summaries appear by Ken Haapala on SEPP's TWTW, on Roy Spencer's blog and on ClimateGATE.NL, (Theo Wolters):
Sherwood and Craig Idso emphasized the benefits of CO2, ("CO2 enrichment") with examples from tree growth and fruit harvest in quality and quantity.
Craig also related coral colours to current symbionts, which die - and make corals look anemic - until repopulated by others that better adapt to a change in sea water temperature.
Kinninmonth, Gray and Spencer targeted the oceans as the main driver of the climate. I don't think anyone would disagree with that role in principle, and with various currents and the thermohaline ocean conveyer belt movements, but the scenario failed to come to grips with the mechanism and the AMO/PDO link with its interaction between and solar cycles. If at Las Vegas this presentation received much attention, it was probably as an offset to some of the purely atmospheric topics of years past.
L ¼ning - in the absence of Svensmark and Shaviv being the one of only two solar contributors with Abdussamatov - summarized "Die Kalte Sonne".
Abdussamatov's presentation, which I mentioned in CliSci # 173 suffered from his heavy Russian accent, but could largely be read from the screen projection.
They were fortified by Don Easterbrook, who also expects we are on the threshold of a cooling period. He sees a connection between the PDO and through Carbon and Beryllium isotope evidence with the Svensmark theory, thereby adding a necessary complement to the Kinninmonth et al presentation.
Watts and Gould discussed their new report on temperature measurement at US surface stations. Others, including Roy Spencer talked about the overestimation of warming trends in the models.
And much more.
The 600 who attended (which included FoS' Ken Gregory) saw it as a fruitful opportunity for renewing contacts and friendships in the far-flung world of sceptics.
Paul Driessen: I am heartened by the knowledge that we here gathered today will fight on for honest science, affordable energy, accountable government, and better lives for billions of people and against the dark forces of climate fanaticism. I also know we are being joined by more and more countries, as they increasingly understand the true nature of this ideological conflict.
CliSci # 173 2014-07-10
The year 1540
A climatic disaster struck central Europe early in 1540.
Weather had been quite normal in the beginning of the century. The Medieval Warm Period was past its peak by now and mild and rainy years produced rich harvests until in December 1539, when it ended with storms and a large amount of rain. Then, in January began a dry phase that lasted practically unbroken for eleven months. Rivers ran dry, there were severe shortages of drinking water, crops failed, animals died and large fires were common. The summer provided a record heat wave.
For the IPCC to declare 2003 the hottest summer in recorded history leave them open for some argument.
Oliver Wetter (Un of Bern) and his group of 32 researchers have located and examined some 300 chronicles of the event and published their results in the June 2014 periodical "Climate Change" ("The year-long unprecedented European heat and drought of 1540 a worst case.").
Abstract:
The heat waves of 2003 in Western Europe and 2010 in Russia, commonly labelled as rare climatic anomalies outside of previous experience, are often taken as harbingers of more frequent extremes in the global warming-influenced future. However, a recent reconstruction of spring summer temperatures for WE resulted in the likelihood of significantly higher temperatures in 1540. In order to check the plausibility of this result we investigated the severity of the 1540 drought by putting forward the argument of the known soil desiccation-temperature feedback. Based on more than 300 first-hand documentary weather report sources originating from an area of 2 to 3 million km2, we show that Europe was affected by an unprecedented 11-month-long Megadrought. The estimated number of precipitation days and precipitation amount for Central and Western Europe in 1540 is significantly lower than the 100-year minima of the instrumental measurement period for spring, summer and autumn. This result is supported by independent documentary evidence about extremely low river flows and Europe-wide wild-, forest- and settlement fires. We found that an event of this severity cannot be simulated by state-of-the-art climate models.
There is a review article of the paper in "Spiegel Online - Wissenschaft", which is in German. I have checked the Google Translate and found it better than most, but still wanting: German syntax is hard to translate by machine and results on some occasions in an opposite meaning.
Now, was this a mega blocking event? Or did the rapid changes have anything to do with a last hot gasp before the Sp ¶rer Minimum (defined by John Eddy, 1976 as being from 1460-1550)? Does our 1000 year long Modern Warm Period, culminating around -say- 2000 presages the next Solar Grand Minimum, in line with the solar millennial cycle? May you all live long enough to notice.
The Svensmark integration
In 2007 Henrik Svensmark and Nigel Calder published a book called "The Chilling Stars - A New Theory of Climate Change". Now, let 's face it: most people do not read 245 page books. If you belong to them, then an article Svensmark published in Astrogeo portion of the 2007 Oxford Journals is just for you. Called "Cosmoclimatology" it is just seven pages with illustrations and can be downloaded free HERE or at <http://astrogeo.oxfordjournals.org/content/48/1/1.18.full.pdf>
You know how the "solar wind" more or less deflects galactic cosmic rays from the earth 's atmosphere. GCR particles make aerosols. When total solar magnetic flux is low, lots of GCR get through and assists in creating condensation nuclei in the Lower Troposphere. The levels of global low-level clouds have a significant influence on surface temperatures. This qualitative theory, backed by experimental tests in the famous Copenhagen basement and later in the CLOUD experiment at CERN have a quantitative conclusion:
"The 2% change in low cloud during a solar cycle will vary the input of heat to the Earth 's surface by an average of about 1.2 Wm 2, which is not trivial. It can be compared, for example, with 1.4 Wm 2 attributed by the Intergovernmental Panel on Climate Change for the greenhouse effect of all of the additional carbon dioxide in the air since the Industrial Revolution (Houghton, 2001)."
The paper then explains the reason for the difference in behaviour of the opposite polar regions which has long puzzled many (the Polar see-saw), visits the Little Ice Age, some millennium scale cycles (on basis of 10Be and 36Cl), to expand into the history of the planet (Snowball Earth) and the galaxy, by hooking up with the work of astrophysicist Nir Shaviv and geologist Jan Veizer (2003) on how the solar system moves through arms of the galaxy, varying the supply from the GCR source.
One does not have to go that far back in time in order to see that the Svensmark GCR theory should be on the front row of candidates for the solution of a critical part of the climate enigma. The delayed behaviour of the oceans may well form the complementary earth-bound aspect, which may well include orbital forces.
It should not surprise anyone why the CO2-obsessed IPCC crowd trivialises and ignores the GCR concept. Its a dangerous enemy to their cherished solution. May-be CO2 occupies the missing 0.2 Wm-2.
The observable emanations from the sun are well enough known and understanding the impact of the "solar wind" on the GCRs does not require full knowledge of the complex actual workings inside the sun.
In any case, I urge you to download this paper. You could do worse for your summer reading at the lake.
Censorship at the AMS ' Journal of Climate
The Times reports that the American Meteorological Society 's Journal of Climate censored portions of a paper that questioned the accuracy of computer models used to predict global warming. One academic reviewer said that a section should not be published because it would lead to unnecessary confusion in the climate science community . Another wrote: This entire discussion has to disappear.
"The paper suggested that the computer models used by the UN 's Intergovernmental Panel on Climate Change (IPCC) were flawed, resulting in human influence on the climate being exaggerated and the impact of natural variability being underplayed.
The findings could have profound implications. If correct, they could mean that greenhouse gases have less impact than the IPCC has predicted and that the risk of catastrophic global warming has been overstated.
However, the questions raised about the models were deleted from the paper before it was published in 2010 in the American Meteorological Society 's Journal of Climate. The paper had been submitted in July 2009, when many climate scientists were urging world leaders to agree a global deal on cutting emissions at the Copenhagen climate change summit in December that year.
Vladimir Semenov, a climate scientist at the Geomar institute in Kiel, Germany, said the questions he and six others had posed in the original version of the paper were valid and removing them was a kind of censorship . (GWPF)
Habibullo Abdussamatov at Las Vegas ICCC 9
The St Petersburg solar physicist of the Pulkovo Observatory spoke on the "Solar Science &K Climate" Panel 7 at the Heartland Conference this week flanked on by Willie Soon and Sebastian L ¼ning. Videos of the presentation are available on <http://climateconference.heartland.org/>, but let me give you a taste of the Russian 's presentation which might scare your children and grandchildren. One quote, taken as a grab from the conference 's screen explains how the coming Grand Minimum can be a self-amplifying process once a decrease in solar activity is taking place. Which is what it is doing at present:
" The subsequent increase of the Bond albedo (in particular because of increasing surface of snow and ice coverage) and decrease in the content of greenhouse gases (mostly water vapour in the surface air, as well as carbon dioxide and other gases) in the atmosphere due to cooling will lead to an additional reduction of the absorbed portion of solar energy and reduce the influence of the greenhouse effect.
These changes will lead to a chain of recurrent drops in the Earth's temperature, which can be comparable to or surpass the influence of the direct effect of the TSI decrease in a bicentennial cycle.
The start of the Grand Minimum of TSI is anticipated in cycle 27 ±1 in 2043 ±11 and the beginning of the phase of deep cooling of the 15th Little Ice Age (of the Maunder Minimum Type) in the past 7500 years approximately in 2060 ±11, with possible duration of 45-65 years."
[from a screen grab of the video of his presentation. E&EO]
It is not that Abdussamatov 's presentation is new. He has been publishing on the sun 's influence on Earth 's climate for at least ten years, but his predictions are getting stronger with subsequent confirmation of his interpretation.
Solar-notch model
For those following the disclosure of the Evans/Nova Solar-Notch model, David Evans has made his climate model available for download here.
The home for all things pertaining to the model is:
http://sciencespeak.com/climate-nd-solar.html
CliSci # 172 2014-06-30
The case of the President 's Science Advisor.
John Holdren has been Science Advisor of US Presidents (of and on) since 1994 and since 2009 for Barack Obama. His involvement in "the Climate File" dates back a long time (he was previously Harvard Professor of Environmental Policy) and in the positions he has occupied he has had a devastating influence on the course of climate science research, which was then already a political crusade, rather than a scientific research subject.
In a lengthy post on WUWT Dr Tim Ball traces that career from his days of a being a promotor of the Malthus and Ehrlich tradition of population control and the Club of Rome, (with some excesses he would rather have people forget today), to his present active support from the IPCC 's hockey stick science. The current highlighting of Holdren is in view of his recent "personal opinion" statement given among the full regalia of the White House, of the sort Lord Acton would have commented There is no worse heresy than that the office sanctifies the holder of it.
It is frightening to think that he is Mr.Obama prime source of information and policy creation on science matters.
Abrupt Climate Change
The record of planet Earth contains some examples of rapid, major changes in Global Temperature. While the events are generally well recognisable in micropaleontology, sedimentology and other proxies, there is a marked lack of a agreement about what causes these shifts.
Examples are the Younger Dryas, some 15,000 years ago (CliSci #168) and the Dansgaard-Oeschger cycles, some 40,000 years ago, during the last glaciation.
Judith Curry decided to take another look, recognising how important these sudden climate kicks are in the context of our search for the cause(s) of climate change.
She is in particular taken by a paper by Petersen et al in Paleoceanography, the Abstract of which reads:
"We present a new hypothesis to explain the millennial-scale temperature variability recorded in ice cores known as Dansgaard-Oeschger (DO) cycles. We propose that an ice shelf acted in concert with sea ice to set the slow and fast timescales of the DO cycle, respectively. The abrupt warming at the onset of a cycle is caused by the rapid retreat of sea ice after the collapse of an ice shelf. The gradual cooling during the subsequent interstadial phase is determined by the timescale of ice-shelf regrowth. Once the ice shelf reaches a critical size, sea ice expands, driving the climate rapidly back into stadial conditions. The stadial phase ends when warm subsurface waters penetrate beneath the ice shelf and cause it to collapse. This hypothesis explains the full shape of the DO cycle, the duration of the different phases, and the transitions between them and is supported by proxy records in the North Atlantic and Nordic Seas."
But the matter is far from settled.
Luboš¡ Motl, the Notches and Chaotic Weather
In the previous CliSci (#171) I reported on the work by Joanne Nova and David Evans who introduced the hypothesis of the "notch filter" in solar energy peaks, which would be an indication of changes in the solar magnetic field(s).
In Luboš¡ Motl 's blog The Reference Frame, the well-known Czech sceptic has worked with Evans ' math and takes exception in an important philosophic/scientific response, part of which reads:
If you ask about my guess, I am with Richard Lindzen and I do think that all the wiggles of the climate that are comparable to the changes in a decade or 20 years or to the changes by something modest of the order of 0.3 °C are due to the internal variability. These changes at these timescales are effectively "weather" which means that they're largely chaotic and you won't find any simple, demonstrably causal "external driver" that is responsible for all of them. Some people are obsessed with determinism so even if they abandon the dominantly CO2-driven theory of the climate, one which clearly disagrees with the empirical data, they still believe that there must be another equally clear driver of all the changes, by every tenth of a degree. But this isn't necessarily so. It's probably not the case. Many things just don't have deterministic causes and the weather isn't something that only affects the 1-day timescale. The significant effects of variable weather survive at much longer and possibly all timescales.
Only when the temperature changes become comparable to 8 °C, the difference between the interglacials' and ice ages' temperature, it's clear that most of the changes are externally driven, by the Milankovitch cycles rooted in astronomy. The evidence that the Milankovitch theory works, as clarified by Roe, is overwhelming. But in principle, all temperature changes that are substantially smaller than 8 °C may totally nicely be due to the "weather", some chaotic internal behavior of the Earth's atmosphere and the world ocean that admit no sharp predictive and no clearcut attribution.
Then, a few days later( 28/6), comes David Archibald in WUWT stating that Evans, with his 11 year optimisation, may well have answered his own question as to when the real cooling is to start. With the TSI having started to drop in 2003 (didn 't Livingston/Penn say 1997?) and with the hindcast model being as good as it is, that would be "from just about now". And: "The model has temperature falling out of bed to about 2020 and then going sideways in response to the peak in Solar Cycle 24. [.....] The only forecast of Solar Cycle 25 activity is Livingston and Penn 's estimate of a peak amplitude of seven in sunspot number. The last time that sort of activity level happened was in the Maunder Minimum."
This post resulted in 337 comments with Leif Svalgaard leading the critics squad, calling his opposition (specifically including Lord Monckton of Brenchley) "wrong", stupid" and "dumb".
"White noise" model, says Willis E. Take a ringside seat.
The trouble with the USHCN
On his Real Science blog Steve Goddard belled the cat of the US Historical Climate Network: Forty percent of the data is fake and blogger Paul Homewood has investigated massive temperature adjustments in Texas and Kansas that have added as much as 2.2 degrees Celsius of warming in the 70 years prior to 2013.
This is described in Ken Gregory 's Science News ' section of the Friends of Science's Quarterly Newsletter for members (June 30th), complete with links to the original articles of Goddard and Homewood, as well as Anthony Watts and Judith Curry, who joined the fray.
News? Call it a work in progress. Shades of Essex & McKitrick 's T Rex (Taken by Storm, Key Porter 2002) who exposed the fiction of the temperature records that tyrannised climate science and of years of critical assessment by Watts of station quality, siting and removal.
Despair of the Alarmists
In continental Europe, the centre of climate alarmism is the PIK in Potsdam, near Berlin. There, Rahmstorf and Schellnhuber are leading the attack, but their arguments are increasingly desperate and they are meeting increasing disbelief.
Rahmstorf, after selectively abusing Polar ice statistics, is singing again the dirge of ocean acidification by CO2, while the oceans remain decidedly alkaline. As an oceanographer he darned well should know better. He is reported to have said that "our anthropogenic CO2 was causing an acidification of the ocean, which has increased 30% (pH is an exponential scale). The average pH actually has declined from a pre-industrial ~ 8.15 to ~ 8.05 (Feely et al 2006).
As reported in Gosselin 's NoTrickZone blog, sceptical EIKE geologist Friedrich-Karl Ewert reminds the public that CO2 is the building block of coral reefs and CaCO3 as material for limestone has been prominent throughout geologic history.
A DDS reader reminds us that the high-CO2 atmosphere of the Cambrian was around 7000 ppm, almost twenty times that of today. It so happened to coincide with the largest explosion of life and life forms on the planet. And, also in that DDS issue, Arthur R ¶rsch points out that the relatively high pH of ocean water is not that much dependent on the H2CO3/ »HCO3 buffer, but on the large amount of Mg º º and Ca º º ions.
Dutch geologist Olaf Schuiling suggests that the mafic, alkalic minerals of the sea bottom (Olivine, predominantly) are effective in keeping the pH well above the neutral 7. Polar water has a pH of 8.2, while equatorial oceans are about 7.95, though mixing takes place through the normal oceanic circulation patterns.
Fair-Questions.com
A half hour video covers an interview by David Berner with Vivian Krause, the scourge of US "Charities" (TIDES) that want to block resource development in Western Canada.
<https://www.youtube.com/watch?feature=player_embedded&v=w37V3Te88TA
CliSci # 171 2014-06-20
Twiddling with Thwaites
You may recall from CliSci # 169 that two research papers came out (Rignot in GRL and Joughin in Science 344 p.735) that sung the swan song over the Thwaites Glacier of West Antarctica, extending the effect beyond the area of measurements, predicting catastrophic collapse of West-Antarctic glaciers and reminding readers that the glaciers hold enough water to raise global sea level by 1.2 metres. In an alarmist story by Suzanne Goldenberg in the Guardian , this worthy successor to George Monbiot bid "up to 4 metres".
I commented then that I thought that "These computer-driven gentlemen seem to be particularly myopic in their projections."
Apart from the West Antarctic area and its ice shelves being buffeted by the circumpolar ocean current, a study by Schroeder, Blankenship et al of the Geophysics Institute University of Texas, published in PNAS now explains that a geothermal heat source underlies the massive glacier, which itself is up to 4,000 metres thick (half of it below sea level) and consequently underlain by water. It 's the most complex thermal environment you might imagine, said co-author Don Blankenship, a senior research scientist at UTIG and Schroeder 's Ph.D. adviser. And then you plop the most critical dynamically unstable ice sheet on planet Earth in the middle of this thing, and then you try to model it. It 's virtually impossible.
The Pause? Lousy data and poor models are to blame
Researchers from the European Space Agency's Directorate of Earth Observation and from National Centre of Earth Observation at the University of Reading, respectively, have opined that the sea surface temperature data are "lousy", as they are the worst indicator of global climate and that "The models don't have the skills we thought they had. That's the problem".
Both organizations are supportive of the IPCC's hypothesis, as is the Guardian newspaper that reported this.
One could detect a certain amount of frustration about this ongoing pause/hiatus that is starting to eat into the warmists' own sense of credibility.
Exploring the Sun
In a series of posts on her blog (HERE and HERE and HERE), Joanne Nova and husband David Evans have started to build their Solar Model. They explore the relationship between temperatures and the TSI. It includes their work on a natural "notch filter" in the recorded solar energy peaks (actual notch filters are used in electronics to filter out hum and noise peaks) and they are finding interesting correlations, some inverse, some with a predictive aspect, involving the solar polar magnetic field strength (recall the complexities of the dual dynamo?), the TSI and the temperature, in combination with Svensmark 's work.
Jo introduces the three parts (so far) of their work in understandable terms. The authors would be the first to acknowledge the "work-in-progress" nature of the posts and the numbers of open questions that still remain.
Says solar physicist Oliver Manuel: "JoNova and David Evans are in the process of discovering Earth 's climate is driven by the Sun 's deep-seated magnetic fields (and the X Force) from the Sun 's compact innards (Fe-mantle and/or pulsar core)." For the X-force see Evans ' discussion which will be welcomed by engineers, but the illustrations will tell the story for most of us too. See also remarks by "Tallbloke" on his blog and some expert comments.
David Archibald tracks the Sun
One falls into the habit of talking blandly about "solar activity", but it is useful to realise that there area number of factors to be considered. Some are more easily charted, or even understandable than others, or of a different scale altogether (the SIM cycles, the magnetic phase "flips"), but all are united in one observation: something unusual is happening.
In a WUWT post geologist David Archibald presents a number of graphs on the solar behaviour, showing different, but related evidence of an approaching minimum, such as the F10.7 Flux, the magnetic activity Ap Index, the interplanetary magnetic field and - what he considers one of the more important graphs - the SODA, Sum of Polar Field Strengths.
Comparisons are being made with both the Maunder and the 1970's cool period.
The author follows the Friis-Christensen & Lassen (1991) school of cycle length and makes some predictions.
Vukcevic (pro) and Svalgaard (contra) have at it in the comments.
See also the more scholarly treatment by Norwegians Solheim, Stordahl and Humlum, or HERE in a final pdf version.
Expecting consistency between models and observations is an "error" (!?)
This is the position of the editor of Environmental Research Letters, explained as an aftermath to the rejection of the Bengtsson paper. See Steve McIntyre's comments in Climate Audit.
The actual statement from IOP Publishing, complete with the reviewers' reports is HERE.
CliSci # 170 2014-06-10
McKitrick 's Calgary presentation
Dr Ross McKitrick 's presentation to the Friends of Science made its mark in Wattsupwiththat with a link to the video and with a number of interesting comments from its readers:
Kev-in-UK 12:49: "An excellent presentation but perhaps more importantly, one that even all the warmists and alarmists must agree with the concluding remark. Everyone, including the warmists knows full well that making a bum policy decision is not wanted. But making a doubly ' bum policy decision in terms of committing to the wrong ' path when it would be easy to wait for just a few years longer, is BY FAR the most sensible option.
Of course, it should also be noted that these facts ' presented by Ross are well known and have been carefully glossed over by the AGWers to ensure continued alarm and avoid real pragmatic analysis. IMHO, any warmist that does not agree with this stance is most likely just worried about their place at the trough, rather than the possible waste of human resources and/or the waste of human lives affected by enforced fuel poverty, etc."
and at 12:54 pm: "What I liked about Ross ' presentation was that there was very little opinion and the use of the official ' IPCC data! he basically demonstrated his point entirely using the alarmists pet ' data and subsequently applied sensible logic in how to move forward."
Mosher 2:53 pm: "Part of the problem is that skeptics have played a role in diverting attention from these facts.
1. When you spend time discussing the colors of charts, that is time not spent on these fact,
2. when you spend time discussing gravity theories" that is time not spent on these facts,
3. when you discuss the 97%,
4. when you focus on antarctic ice,
5. when you accuse NOAA of fraud in the temperature record,
6. even when you attack mann,
any time you discuss something other than the facts that Ross focuses on you divert attention from the real issue, from the only important issue.."
....as well as a wrap-up, background and local reaction by FoS ' Ken Gregory at 12:32 am on the WUWT blog section.
Sun/Earth connections, a statistical analysis from China
Beijing-based XH. Zhao and XS. Feng have written in the Chinese Science Bulletin an article entitled "Periodicities of solar activity and the surface temperature variation of the Earth and their correlations". The paper is in Chinese, but the Abstract has a translation in English. The authors conclude:
"The main results are as follows. (1) Solar activities (including sunspot number and TSI) have four major periodic components higher than the 95% significance level of white noise during the period of interest, i.e. 11-year period, 50-year period, 100-year period, and 200-year period. The global temperature anomalies of the Earth have only one major periodic component of 64.3-year period, which is close to the 50-year cycle of solar activity. (2) Significant resonant periodicities between solar activity and the Earth 's temperature are focused on the 22- and 50-year period. (3) Correlations between solar activity and the surface temperature of the Earth on the long time scales are higher than those on the short time scales. As far as the sunspot number is concerned, its correlation coefficients to the Earth temperature are 0.31-0.35 on the yearly scale, 0.58-0.70 on the 11-year running mean scale, and 0.64-0.78 on the 22-year running mean scale. TSI has stronger correlations to the Earth temperature than sunspot number. (4) During the past 100 years, solar activities display a clear increasing tendency that corresponds to the global warming of the Earth (including land and ocean) very well. Particularly, the ocean temperature has a slightly higher correlation to solar activity than the land temperature. All these demonstrate that solar activity has a non-negligible forcing on the temperature change of the Earth on the time scale of centuries."
The link to this story comes from WUWT, where the supporters and the usual critics of a solar-related climate-change cause, encouraged by Stanford solar physicist Leif Svalgaard, come to blows.
INTECH 's open access book "Global Warming"
This 250 page, eleven chapter book by eleven groups of writers contains papers on cyclones and monsoons, Greenhouse gases, CO2 vs the Sun, nuclear alternatives, some impact papers on hydrology, transportation, tundra vegetation, and a paper by Madhav Khandekar "Global Warming, Glacier Melt & Sea Level Rise: New Perspectives", which has been downloaded 5000 times since its publication a few years ago.
The book 's index is HERE and Madhav 's paper can be downloaded HERE.
Another worthwhile paper is a 38 page general overview of CO2 and Solar cause alternatives by Florides and colleagues from Cyprus; their "Global Warming: CO2 vs Sun" is HERE.
It 's the Sun, Stupid (2)
In the previous Newsletter (# 169) I reported on the efforts by WUWT regular Willis Eschenbach to disprove any measurable sign of the sunspot cycle on climate factors on earth and dared anyone to disprove it.
It did not take long for Dutch science writer Marcel Crok to remind him of Nir Shaviv 's 2008 JGR paper "Using the Oceans as a Calorimeter to Quantify the Solar Radiative Forcing".
Shaviv studies three independent records: Five decades of ocean net heat flux, the SL change based on 100 years of tide gauges readings, and sea surface temperature variations. In the abstract of the JGR paper he states:
" We find that the total radiative forcing associated with solar cycles variations is about 5 to 7 times larger than just those associated with the TSI variations, thus implying the necessary existence of an amplification mechanism, though without pointing to which one."
Shaviv explains his technique in a paper on his website ScienceBits: "The Oceans as a calorimeter" and states why he believes that the IPCC scientists don 't see the changes in the solar radiation: because such a large part of it goes into the oceans.
-
1600 dead mink
My readers will know that I am not wont to delve into 'impact studies', particularly not those that emanate from the IPCC 's WG2 section, which projects the computer-simulated fantasies of WG1 's into scare stories for public consumption and give WG3 the green light to spend billions on mitigation. Wind turbine farms in this case.
I am making this exception for a short story based on observation and evidence on the health effects on us mammals of the remedy pushed on us by the IPCC and our governments. Danish mink will serve as the example of the effect of wind turbines to cure us of our addiction to a hydro-carbon based society. Call them the canaries in the coal mine.
Reports have been coming in for years about people in rural areas becoming unwell when they get wind turbines as neighbours, only to be waved away as complainers or for having ulterior motives. Reading this linked report from the World Council for Nature may encourage you to write to your government representatives on various levels.
In the comments, Peter Ridley demurs and the WCFN educates.
(h/t Mark Duchamp)
New US Surface Temperature Network
After decades of criticism of the measured US surface temperatures, mostly due to the station siting and lack of maintenance of the GHCN and USHCN, there now is finally a well laid-out dependable 114 station US network, named USCRN (US Climate Reference Network). This should put an end to the "adjusting" of measured data of the past. Anthony Watts - a meteorologist by trade - who has been in the forefront of the station battle, describes the improvements in his blog and makes some comparisons of data and trends over the last decade.
CliSci # 169 2014-05-30
A collapse of Antarctic Glaciers?
With all reports indicating a healthy buildup of ice in Antarctica, a number of researchers at UCal (Irvine) and CalTech insist that a Widespread, rapid grounding line retreat of the [Amundsen Bay] Glaciers, West Antarctica "may draw down the entire basin" , because they "find no major bed obstacle that would prevent the glaciers from further retreat."
Several of Antarctica 's glaciers have already begun an unstoppable meltdown, two studies suggest. Eric Rignot at the University of California, Irvine, and his colleagues used satellite radar to measure the retreat of five glaciers in West Antarctica and found that there is nothing holding the ice sheets back from catastrophic collapse, leaving them more vulnerable than previously thought. These glaciers hold enough water to raise the global sea level by 1.2 metres.
A team led by Ian Joughin at the University of Washington in Seattle modelled the behaviour of one of these glaciers, the Thwaites Glacier, and found that it is permanently destabilized. He is quoted as saying: The next stable state for the West Antarctic Ice Sheet might be no ice sheet at all, says the Science paper 's lead author.
The melting of Thwaites will probably raise sea levels by 2.5 centimetres over the next century and by more than a millimetre per year within two to nine centuries, the team says.
These computer-driven gentlemen seem to be particularly myopic in their projections.
The movement of the grounding line is as much a function of the currents circulating the Antarctic continent (which hit its West Coast and the Palmer Peninsula) as anything else, and can surely not be extended to the catastrophic collapse as long as the Firn is receiving snow. Nor should it be exported to the main continental ice cap and to sea level conditions over the next century. These projections may count as unwarranted and unscientific alarmism.
See also the somewhat verbose comment by Larry Hamlin .
Michael Mann re-interprets the AMO
As the NOAA says, the Atlantic Multi-decadal Oscillation is a succession of ~30 year quasi-periodic changes in Sea Surface Temperatures, affecting air temperatures and rainfall over much of the Northern Hemisphere. It is a natural feature with a cycle length of 60-70 years, with a warm and a cold phase and has been occurring for at least 1,000 years without anthropogenic assistance.
As the PDO, the NAO and the AMO feature importantly as being of a natural origin and having indirect links to the cosmic ray and neutron flow expressions of solar activity, they interfere with the GHG hypothesis of the IPCC.
Hence a paper by Michael Mann in which he re-characterizes the AMO.
It 's a matter too complicated for quick summaries and I urge those of you interested in the matter to go to Nic Lewis ' solid critique, which also provides hyperlink access to a pre-print of Mann 's GRL paper.
It's the Sun, Stupid ....or is it not?
In what must be the most enjoyable WUWT discussion of the year, regular Willis Eschenbach, who has never been impressed by the sun as having much to do with climate change, states that the ~11-year solar cycle - being the strongest - should be showing an influence on climate, but doesn't. He challenges everyone to disprove him.
In this, he is supported by California astrophysicist Leif Svalgaard and opposed by many others, including some scientists who do not usually bother.
Opinions vary between "garbage post" to more mildly negative.
As a reaction, Lord Monckton (24/7, 3:17pm) makes a clear statement that remains largely unchallenged.
Others point out that eleven years is too short to overcome the transmission delay at the stratosphere/atmosphere and atmosphere/ocean boundaries and that only prolonged changes in the sunspot record will leave their mark, such as the LIA stages. Others refer to the river flow studies in South Africa, South America (Archibald, Alexander).
Plus a couple of hundred other comments.
Monckton and the Dead Parrot
for those who remember Monty Python
<http://wattsupwiththat.com/2014/05/25/monckton-and-monty-dead-parrot-parody-of-ipcc/>
'Pattern Recognition in Physics'
You may recall that a disagreement with publisher Copernicus in January caused the cessation of this promising open access journal, PRP.
There was in its Special Issue a treasure grove of solar and planetary work that PRP now wishes to disown. You will find the links to the papers of "Pattern in solar variability, their planetary origin and terrestrial impacts" (Editors: N.-A. M ¶rner, R. Tattersall, and J.-E. Solheim) on my dropbox but I am uncertain whether the links in it are "life" outside my own computer.
Some can still be found at
<http://www.pattern-recogn-phys.net/special_issue2.html>
I'd say: download those of interest for your files before they disappear.
There have been grumblings about scientific correctness (not only of the political kind) and the peer review process, but let it be recognized that we are still flailing in the dark about so many essential extraterrestrial matters. Yes, some are speculative.
CliSci # 168 2014-05-20
Decades of cooling?
Pierre Gosselin presents in his NoTrickZone blog a translation of a review by L ¼ning and Vahrenholt (originally in Die kalte Sonne) entitled "Will the solar doldrums of the coming decades lead to Cooling?" (also reported in CCNet of May 12th), which includes many new articles by Qian, Zhao, McCracken, Roth, Salvador, Goelzer, Ollier and Ahluwalia.
The first few authors are presenting an inventory, while others projects what is happening today into the future, with Salvador forecasting a Solar Minimum of 30 to 100 years by agreeing with Ian Wilson 's Venus-Earth-Jupiter Tidal Torque theory. Goelzer ties in to the theory by Schwadron (2010) that has CMEs rule magnetic flux of the heliospheric magnetic field, of which the intensity is correlative with sunspot numbers. Then she proceeds with making predictions.
Regrettably, much of this is behind paywal: Abstracts only.
It also contains remarks from Russian investigators Baschkin and Galiullin who say "that - measured on a geological scale - the occurrence of a new Ice Age is approaching".
That, however, is a problem of yet another dimension.
In a post on WUWT, David Archibald observes that so many solar physicists are keeping themselves a loophole when discussing solar influence on climate and he states that "The price of getting published in solar physics is abjuring any role for the Sun in climate". As a result, he says, their papers on the subject are "like reading Pravda in Soviet times."
Asteroid Climate Impact of Chicxulub
In a PNAS paper, "Rapid short term cooling following Chicxulub impact at the Cretaceous-Paleogene Boundary" Vellekoop et al demonstrate how the impact of an asteroid at this well-known Mexican location, 66 million years ago, caused a short lived global cooling, a so-called "impact winter" phase.
The authors document a major decline in sea surface temperature during the first months to decades following the impact event, using TEX86 paleothermometry of sediments from the Brazos River section, Texas. They interpret this cold spell to reflect what may be the first direct evidence from the effects of the formation of dust and aerosols by the impact and their injection into the stratosphere, blocking incoming solar radiation. This impact winter was likely a major driver of mass extinction because of the resulting global decimation of marine and continental photosynthesis.
....................but not in the Younger Dryas
Some 15,000 years ago the last Pleistocene Glacial Phase came to a sudden end, after first an even colder glacial dip (Older Dryas) followed by a rapid rise to the Aller ¸d warm period which lasted about a thousand years and was terminated by another 1300 year cold period, known as the Younger Dryas, after which warming followed to temperatures warmer than today. See WUWT for a summary and a graph that illustrates the rapid changes in context.
These well-documented changes were nothing like what the world is worrying about at present: Sea Temperature variation was as much as eight degrees up and down, sea levels dropped 100 metres, the Atlantic thermohaline circulation system was disrupted and biosystems (including humans) were severely affected.
Much has been written about these events but a cause has not been found, so that - unavoidably - comets, asteroids and the like were fingered as culprits, most recently by researchers at UCal at Santa Barbara. But Meltzer et al, also in the PNAS, having looked at 29 prospective impact sites worldwide, insist that the claim can be rejected.
Despite some ribald suggestions by WUWT readers, the Dryas/Aller ¸d mystery continues.
Professor Bengtsson seeks open discussion and finds himself facing McCarthyism
Well over a month ago Swedish Meteorologist Dr Lennart Bengtsson, 2006 winner of the 51st IMO prize of the WMO, deviated from the IPCC 's dogmatic effort, seeking intelligent exchange of ideas with others, according to the general idea of proper scientific enquiry and stating that he did not believe in "consensus science". He accepted an invitation last month to join the Academic Advisory Council of the Global Warming Policy Foundation (Henderson, Lawson, Peiser and two dozen others).
All hell broke loose in the warmist camp.
He resigned this GWPF position after only three weeks, having "been put under such an enormous group pressure [as] has become virtually unbearable to me"...... "It is a situation that reminds me about the time of McCarthy."
Read the correspondence on the GWPF website . Comment on most blogs.
It is also interesting to read Marcel Crok 's Essay about his interview with Dr Bengtsson in WUWT , but even more interesting to read his reproduction of an interview that Simon Rozendaal had with him back in 1990 (Elsevier weekly magazine) in which he was already critical of IPCC practices. He says he has always been a "sceptic" as it is normal for a scientist and is not a bad word.
Dr Ross McKitrick presents "The Pause"
At the 11th Annual Luncheon of the Friends of Science Society Professor McKitrick presented the consequences of the "pause in global warming" and the launched into a critical analysis of the IPCC 's "model" approach to climate projections, the alarmism of its presume impacts and the uselessness of its expensive mitigation efforts.
The essence of his talk can be seen in his illustrations. Incorporated into a video of the talk they will be posted in context on the FoS website.
The presentation by Dr McKitrick was well covered by Licia Corbella in the Calgary Herald and in Benny Peiser 's GWPF .
German government falsely reports on IPCC summary
As if the IPCC summaries are not already bad enough, German government officials rewrote the AR's official summary for media use and deliberately made it even worse, reports GWPF from Welt am Sonntag.
Emission trading is the important mechanism in the EU and Germany has built its alternate energy and environmental program around it. But in the report the IPCC had confirmed that under the fixed cap of European emissions trading with its precisely calculated amount of pollution rights, renewable energy subsidies only lead to a shift of CO2 emissions, but not to their reduction.
See also Bjorn Lomborg in the Financial Times .
Meanwhile, the Australian government has cut the climate change related programs in its budget by 85%. See the Guardian/LibertyVoice.
Comparing temperature data sets
David Dohbro compares five global temperature data sets in a WUWT post, three land based (GISS, NCDC, HadCrut4) and two satellite based (RSS, UAH), with the two US surface sources having the largest deviation from the remotes. The display of the different levels and divergence is of some interest, but needs some more work. The RSS differential may be due to orbit decay says Roy Spencer.
CliSci # 167 2014-05-10
Much of Arctic Warming found to be Natural
Qinghua Ding and colleagues from the University of Washington have a paper in Nature 509, 209 212 (08 May 2014) entitled "Tropical forcing of the recent rapid Arctic warming in northeastern Canada and Greenland" in which the conclusion differs substantially from the usual AGW-compliant Nature articles..
In particular note the last sentence of the Abstract. See the link above for references.
Abstract:
Rapid Arctic warming and sea-ice reduction in the Arctic Ocean are widely attributed to anthropogenic climate change. The Arctic warming exceeds the global average warming because of feedbacks that include sea-ice reduction and other dynamical and radiative feedbacks We find that the most prominent annual mean surface and tropospheric warming in the Arctic since 1979 has occurred in northeastern Canada and Greenland. In this region, much of the year-to-year temperature variability is associated with the leading mode of large-scale circulation variability in the North Atlantic, namely, the North Atlantic Oscillation. Here we show that the recent warming in this region is strongly associated with a negative trend in the North Atlantic Oscillation, which is a response to anomalous Rossby wave-train activity originating in the tropical Pacific. Atmospheric model experiments forced by prescribed tropical sea surface temperatures simulate the observed circulation changes and associated tropospheric and surface warming over northeastern Canada and Greenland. Experiments from the Coupled Model Intercomparison Project Phase 5 models with prescribed anthropogenic forcing show no similar circulation changes related to the North Atlantic Oscillation or associated tropospheric warming. This suggests that a substantial portion of recent warming in the northeastern Canada and Greenland sector of the Arctic arises from unforced natural variability.
Sea ice and the Beaufort Gyre
Almost complementary to the above, there is an article by Krishfield et al in JGR entitled "Deterioration of perennial sea ice in the Beaufort Gyre from 2003 to 2012 and its impact on the oceanic freshwater cycle" states that perennial sea ice has deteriorated since 2003, the starting point of the study, to be replaced by thinner new ice. They record "fresh water export" from the region and find that the anti-cyclonic climate regime, persistent in the Gyre since the late 1990 's (so they say) may be weakening, affecting warmer and wetter climate locally and possible cooling in the North Atlantic.
The time period is short, last year 's ice levels (not part of the study) were sharply up and this winter did not see a reduction of multi-ytear ice. It is important to realise that they state that apparently the Arctic ice was blown away, not melted away. We have long maintained that Arctic ice cover changes are more subject to wind and sea currents (including the temperature of incoming Atlantic and Pacific water) than any other force.
Some comments may well say that there is little news under the sun, but neither Sun nor CO2 feature in the article, as far as I could see.
Between the Luke-warmers and the Dragon Slayers
Dr Roy Spencer published on his blog on April 25th what he calls his "Top 10 list of stupid skeptic arguments" and got 630 comments from all sides.
Then Anthony Watts reprints it a week later and another 600+ responses result.
So what 's the problem? What makes these arguments "stupid"?
I am not going to restate why commentators agree or disagree with the ten points; you can click the above links for that. Instead, I would like to observe two points which I think are important in evaluating this, as well as signposts to effective ways in getting one 's viewpoints across.
1 Varied dissent is normal. In fact, in politics as in religion as in science, there may be a camp in which the believers gather with support for a stated political platform or religious belief or scientific tenet and subscribe to its principles at the exclusion of alternatives. Those that oppose such somewhat dogmatic establishments are likely to oppose them for a variety of reasons, some on points of rational analysis or factual evidence, others on matters of principle of methodology or ethics. They often disagree among themselves, making joint opposition less than efficient. That 's why so many revolutions fail!
2 Among those in opposition, there is a range of sceptic voices in many shades of grey. If we want to marshall our forces it would be useful to take stock of the best ways to do this. On this there are two extremes: On the one side there are the type of "Slayers of the Sky Dragon" (currently removed from its Kindle home) which takes several Black or White ' positions that many cannot accept in the context of uncertainties in climate science. John O 'Sullivan and the principals of the Sky Dragon have now flown to "Principia Scientific International" but have not lost their colours.
On the other hand there is a number of scientists that disagree more with the unscientific methodology of the IPCC effort than with some of its conclusions. Some of these are actually still within the IPCC coop. Some do finally get fed up with the charade and quit the fold, causing some publicity. And lose their funding.
They may agree on the abuse of "models", that CO2 is not the danger it is made out to be, have doubts about the positive feedback, the sea level rise, the useless attempts of trying to control climate through CO2. But they don 't use false or tendentious expressions like "acidification of the oceans" on the one side and they don 't say: "CO2 does not cause any global warming", or "the Greenhouse does not exist" on the other.
People like Roy Spencer and Georgia Tech professor Judith Curry are effective in opposing the IPCC politics this way. The latter thus gained access to the US Senate for a well-publicised address. Of course, her recompense is that she is both praised and condemned.
Most of these "Luke warmers" are more effective by finding access to the media a lot easier than the dogmatists.
Anthony Watts has floated the idea to gather all sceptics under one big tent.
There is a feeling that such is not very well possible.
The U.S. National Climate Assessment
This new 35MB PDF file can be downloaded HERE . Note the interesting "scientific understanding" of the adjustment to historic temperatures (manipulating, some may say) that may increase the GW slope. Go to 'Supplemental Message 7' of the A3 Climate Science Supplement on p. 764 of 841. (In case you are wondering, it 's not me that found that).
In comments it is said elsewhere that " adjustments to the temperature record are increasing dramatically. The present is getting warmer, the past is getting cooler, and it has nothing to do with real temperature data only adjustments to temperature data. The climate reality our government is living in is little more than a self-serving construct."
Curry: "Climate Change" now officially a meaningless phrase
On her blog Climate Etc., 6 May 2014 Judith Curry, after reading the U.S. National Climate Assessment Report, makes the case that "Climate Change" has now becoming a meaningless expression.
She states:
"My main conclusion from reading the U.S. National Climate Assessment Report is this: the phrase climate change ' is now officially meaningless. The report effectively implies that there is no climate change other than what is caused by humans, and that extreme weather events are equivalent to climate change. Any increase in adverse impacts from extreme weather events or sea level rise is caused by humans. Possible scenarios of future climate change depend only on emissions scenarios that are translated into warming by climate models that produce far more warming than has recently been observed."
~~~~~~~~~~~~~~~~~~~~~~~~~~~~~~~~~~~~~~~~
CliSci # 166 2014-04-30
Cosmogenic 81Krypton isotope dating of old ice cores
Christo Buizert and colleagues have a paper in PNAS (preprint HERE) about how the cosmogenic Krypton 81 isotope can identify ice age beyond the present capabilities.
They work with a 120,000 year old ice from the Taylor Glacier in Antarctica and claim that their system is able to work back to 1 ½ million years. They state:
"Past variations in Earth 's climate and atmospheric composition are recorded in accumulating polar meteoric ice and the air trapped within it. Ice outcrops provide accessible archives of old ice, but are difficult to date reliably. Here we demonstrate 81Kr radiometric dating of ice, allowing accurate dating of up to 1.5 million year old ice. The technique successfully identifies valuable ice from the previous interglacial period at Taylor Glacier, Antarctica. Our method will enhance the scientific value of outcropping sites as archives of old ice needed for paleoclimatic reconstructions, and can aid efforts to extend the ice core record further back in time."
This would at least theoretically take us back to all of the Pleistocene Glacial Periods, "The Ice Ages", (providing there would be continuing ice record, and taking into account that compaction would demand large sampling intervals and play havoc with accuracy), but it could also give us a closer look at the a previous interglacial or two and the more recent (i.e. 12ky) Dryas/Aller ¸d problem.
Parallel to Svensmark's galactic Cosmic Ray manipulation of climate change through solar wind, the new technique may have some promise there too, muses Anthony Watts.
Tisdale # 5: Ni ±o/Ni ±a and the PDO
In this last section of his essay Bob Tisdale presents his opinion about the association between El Ni ±o/La Ni ±a patterns and the Pacific Decadal Oscillation. He emphasises that the first are primary expressions of Sea Surface Temperature while the PDO is not (which, in the way, is not what his fig 1 implies) and that PDO (wind) patterns somehow follow the SST patterns of the other. Besides, he considers the PDO a small North Pacific event. He ignores the AMO, which appears to run in a slightly offset parallel to it.
His lengthy graph-laden post can be separately downloaded in PDF format HERE , but you will soon get tired and the fun is in the comments of the WUWT post version.
In the discussion it takes some time - as usual - for the real questions to come up: Why then are the PDO and its Atlantic counterpart so important in portraying the regular 60 year cycle of warm and cold ± 30 year periods if the less regular SSTs are supposedly primary? To which Tisdale answers:
"The fact that the PDO was positive during warming periods and negative during hiatus/cooling periods is simply a coincidence. Both are responding to the multidecadal variations in the strengths of ENSO events, and global surface temperatures are also varying in response to the multidecadal variations in the sea surface temperatures of the North Atlantic and of the North Pacific (the latter of which are not represented by the PDO). And of course, there is no mechanism through which the PDO can cause the multidecadal variations in global surface temperatures, since the PDO does not represent sea surface temperatures."
The 60 year cycle is unmistakably a climate expression. And I do not believe much in "coincidences" in science. It may or may not be related to SST, but its origin is likely to be associated with extra-terrestrial forces (solar wind for one), either directly or as an orbital harmonic, as suggested in some comments. It does not cause changes in climate, but may be a reflection of the same process.
We sceptics criticise the IPCC camp for having the blinders on for anything other than a CO2 cause. Are some of us suffering from a similar narrow vision?
Earth ' nuclear core controls major Climate Changes?
- A Thought Experiment
Retired "chip" engineer Ronald Voisin thinks neither CO2 nor the Solar influence have much to do with major Climate Changes. He focusses on the regularity of the Pleistocene and older Glacial stages in terms of a repetitive natural nuclear process, hidden in the earth core. His essay is in WUWT and it is not as wild and wooly as you may think. He has worked out a complete hypothesis (se non ¨ vera, ¨ ben trovato) which elicits a very interesting comment section from the regulars on the blog, including a larger number of geologist readers than usual.
Voisin dismisses CO2 without much ado, but spends more time on rejecting solar variation, though his objections do not come to grips with the totality of its gravity and magnetic cycles. At least it does not satisfy me.
Differentiating between High Frequency/Low Amplitude variations (probably by solar inducement, and typical of an interglacial like today) and High Amplitude/Low Frequency changes (as between glacial stages/interglacial, following Milankovitch) which fit his earth core engine hypothesis, he is obviously not directly applying it to what happened in the last 200 years.
He ties the inner nuclear engine to an expression in plate tectonics, and admits that the periodic interruptions, represented in the 6,000 to 15,000 interglacials are yet to be found on the Atlantic Ocean floor.
There are a lot of valuable thoughts in here and the piece is interesting reading, whether you buy his hypothesis or not. A more elaborate version can be downloaded from Voisin 's Dropbox, i.e. if you happen to have a Dropbox yourself.
An IPCC Lead Author complains
After working for five years as a Co-Coordinating Lead Author in AR5 's Working Group III (Mitigation), Professor Robert Stavins has blown his top. On a Harvard Kennedy School website he complains about the goings on at the final early April Berlin meeting at which 195 country representatives "discussed, revised and finally approved (line-by-line) the 'Summary for Policymakers' (SPM), which condenses more than 2000 pages of text from 15 chapters into a SPM document of 33 pages."
Professor Stavins believes in the correctness and importance of the WG III work and its Technical Report, but can 't stomach what the IPCC Kommandatur did to it. Several of his CLA colleagues agreed that this political document should more properly be called a Summary by Policymakers.
Well, that 's nothing new to us who have following these things for years, but to have a leading green sympathising professional blow the whistle in an open letter to the three co-Chairs of the IPCC Working Group probably is. Read the letter on the link above which is on his blog.
Earth scientists reject Lovejoy 's AGW statistics approach
Adding to the comments given by FoS member and geophysicist Norm Kalmanovitch in the April 17th FoS Press release about the recent paper by McGill University's Physics Professor Shaun Lovejoy - pre-proof version HERE - (99% certainty that human activity causes global warming), there is a post by geologist David Middleton in WUWT in which geological arguments are being brought to bear.
It makes good reading for anyone who realizes that Climate is at least as much an Earth Science matter as it is a Physics one.
In the Comments someone says "Any surprise that geologists government ones excepted are the most sceptical group of all?"
Another gem in the post is the written remark by James Hansen which really is about how to use data so you get the result you want.
PLEASE NOTE:
Dr. Ross McKitrick to address 11th FoS Annual Luncheon
The U. Guelph Economics Professor who rang the bell on the IPCC 's science methods with his book "Taken by Storm" (2002) will speak on Policy Implications and other consequences of various model assumptions based on the overstatement of the effects of Greenhouse Gases.
You will remember him as the man who - with Steve McIntyre - destroyed the "Hockey Stick".
The meeting takes place on May 13th; your invitation and ticket form are HERE and ticket deadline is May 7th. Capacity is limited.
~~~~~~~~~~~~~~~~~~~~~~~~~~~~~~~~~~~~~~~~
CliSci # 165 2014-04-20
Cloud condensation nuclei and surface temperature
Yu and Luo have an article in Environmental Research Letters that looks at the Galactic Cosmic Ray influence on cloud condensation nuclei in terms of solar variations affecting the GCR flux and its relationship with aerosols in general.
What is new in this post-Svensmark look at the solar-cosmic ray issue is its integration with atmospheric processes and its quantitative expression as found in surface temperatures.
Their finding assigns a significant amplifying effect in the lower troposphere, particularly in the summer season in the Northern Hemisphere.
It implies that the IPCC 's opinion about TSI variations being insufficient to affect climate, should be reconsidered.
Temperatures in Seattle
Anthony Watts, who, for years, has been on the case of sloppy siting controls for the surface temperature stations in the US, gleefully reports the finding that the thermometers at SeaTac airport have been reporting temperature one to three degrees higher than surrounding sites for a number of years. These stations are part of the GHCN network, used for climate studies. Pictures show locations between asphalt runways. The problem seems to have been fixed, resulting in a 1.5 F degree drop in the readings.
More Ni ±o talk
Further to the two last items in CliSci # 164:
For those who subscribe to Bob Tisdale 's explanations and consequences of El Ni ±o, his third essay has now appeared on the WUWT blog (with links to the previous two). He predicts another El Ni ±o this year, though not one comparable to the 1998 one.
The ENSO complex and the PDO rule the Pacific, but there is a dichotomy here. The ENSO is a surface temperature event, periodical, but not cyclical, linked to an incubation area in the Western Pacific which creates the Kelvin Wave and interaction with the equatorial current and trade winds.
The PDO is not. Its links (as are those of the semi-parallel Atlantic 's AMO counterpart) are with the TSI, with Svensmark solar wind deflection of GCRs and the neutron count. It relates to the sixty year cycle of climate, while the whole Ni ±o/Ni ±a pair is lifted and depressed with the PDO's oscillation.
But when in the Comment section of his post, a reader brings up the PDO and its link to TSI, Tisdale will not hear of it. He responds with ".... sorry. I don 't really study the PDO for 2 reasons. (1) The PDO is not sea surface temperature data (it 's derived from sea surface temperature data) and (2) the PDO is an after-effect of ENSO." (BOLD mine). A bit myopic wouldn 't you say?
A regular cyclic, solar-linked feature being the after-effect of an irregular sea current? The mind boggles.
Late news: A new chapter in the Tisdale series (his fourth essay) appeared today, in which he promises to address the PDO 's relationship to El Ni ±o in the next one.
Outcome of FOIP request for Mann 's e-mails is bizarre
In the Mann/UVa case, the Virginia Supreme Court has rendered a decision which appears to assign ownership of any research results to the University and its staff. This state university and its staff are paid by tax dollars.
The case runs parallel to the Mark Steyn vs Michael Mann counter suit in which Steyn is asking for millions of dollars in damages. Says one commentator: "If the emails are destroyed, Mark Steyn will win his damages. If the emails are not destroyed we will see them in discovery. This is not going away, just delayed."
Stay tuned.
Scientific evidence vs government policy
The contrast between Government AGW policies and people 's priorities - as expressed in polls - is stark. The pseudoscience of the IPCC has resulted in "projections" which have now been proven incorrect over the past decades.
In a new essay on his website, Dr Tim Ball takes stock of the conundrum.
Solar activity controls East Asia Winter Monsoon
Sagawa et al have a paper in Earth and Planetary Science Letters with the following highlights:
The abstract is HERE as first item on "The HockeySchtick",
followed by some other new interesting papers.
~~~~~~~~~~~~~~~~~~~~~~~~~~~~~~~~~~~~~~~~
CliSci # 164 2014-04-10
NIPCC: CLIMATE CHANGE RECONSIDERED II - 2013-2014
The 2013 report by the Nongovernmental International Panel on Climate Change (NIPCC) provides the scientific balance that is missing from the overly alarmists reports of the United Nations' Intergovernmental Panel on Climate Change (IPCC), which are highly selective in their review of climate science. The NIPCC is an international panel of scientists and scholars who first came together in 2003 to provide an independent review of the climate science cited by the IPCC.
The report consists of three parts:
The "Physical Science" report is here. The Summary for Policy Makers is here.
The "Biological Impacts" report is here. The Summary for Policy Makers is here.
The "Physical Science" report finds that negative feedbacks in the climate system reduce the model model derived temperature sensitivity to values an order of magnitude smaller. Earth's surface temperature are largely driven by variations in solar activity, which may have contributed as much as 66% of the observed 20th century warming.
The "Biological Impacts" report finds that rising temperatures and atmospheric CO2 levels are causing no net harm to the global environment or to human health and often finds the opposite: net benefits to plants, including important food crops, and to animals and human health.
This is a major effort by 50 climate scientists, and the reports deserve wide publicity.
- For some key findings see here.
- Also see the Climate Change Reconsidered website here.
(Ken Gregory)
Solar Cycle 24 progress
The double-peaked high of SC 24 is being tracked by this week 's NASA release which goes into some detail in explaining why there are so many ways to count sunspots.
They call the "smoothed count" for this cycle at 70, which makes it the smallest cycle since SC 14, 108 years ago.
The double nature of the peak is associated with the difference in electro-magnetic activity between the Sun 's North and South poles, which change signature at the cycle 's maximum, but not always quite at the same time. This is known as the sun 's Polar Flip.
An illustration of this can be seen on a illustration by Leif Svalgaard .
------------------------
Failed Predictions
For anyone interested in that sort of thing, HERE is a collection of 107 failed climate predictions, plus a whole lot more in the blog comments.
Peer-reviewed (!) paper: It 's OK to lie about Climate?
In a paper in the American Journal of Agricultural Economics authors Hong and Zhao find that Information Manipulation has an "instrumental value".
The Abstract explains:
"It appears that news media and some pro-environmental organizations have the tendency to accentuate or even exaggerate the damage caused by climate change. This article provides a rationale for this tendency by using a modified International Environmental Agreement (IEA) model with asymmetric information. We find that the information manipulation has an instrumental value, as it ex post induces more countries to participate in an IEA, which will eventually enhance global welfare. From the ex ante perspective, however, the impact that manipulating information has on the level of participation in an IEA and on welfare is ambiguous."
Come to think of it, that 's what a California Professor, the late Stephen Schneider recommended a decade ago:
" ....to capture the public 's imagination. That, of course, entails getting loads of media coverage. So we have to offer up scary scenarios, make simplified, dramatic statements, and make little mention of any doubts we might have."
See also HERE.
(h/t Eduardo Ferreyra)
About El Ni ±o and other Pacific Problems
The ENSO oscillations are Bob Tisdale 's specialty. He regularly publishes on the supposed mechanisms and wages battle with all comers. His "colleague on the other side" must be Kevin Trenberth who, Bob says, "is obviously still trying to keep alive the notion that greenhouse gases are responsible for the warming of the global oceans." That may be a valid comment, but there are more important issues: ENSO is not only a Pacific feature. While it may have its origins in the Western Pacific through an accumulation of warm water that interferes with the equatorial currents and periodically, but irregularly moves East towards the American coast when the balance gets out of wack, its effects are also measurable in the Atlantic and Indian Oceans. In WUWT he discusses a step-wise El Ni ±o behaviour, but it appears to be no more than the (admittedly irregular to - Bob himself says at one point - "chaotic") Ni ±o/Ni ±a pattern being lifted by the regular 60 year cycle of the Pacific Decadal Oscillation.
It seems that here we are parting company. Bob continues: "Since the PDO is an aftereffect of ENSO (with an additional impact of the sea level pressure and corresponding wind patterns of the North Pacific impacting the PDO), I suspect that the PDO will switch modes in response to the upcoming El Ni ±o IF, BIG IF, the El Ni ±o is a strong east Pacific El Ni ±o. " [italics mine]
Specialisations are a hazard in climate science. I can 't buy the idea that a chaotic' ENSO will push the decadal oscillations into its regular pattern. Evidence has increased that the 60 year climate cycle (which is evidenced in the Oscillations of the both Atlantic and Pacific, albeit with a delay) has a solar connection, in harmony also with Svensmark 's cosmic ray experiments. No one can afford to say that he is doing valuable scientific research in the causes of climate change without looking at all possible causes. That includes the orbital and magnetic influences of our star and its planets. It 's bad enough that the IPCC does not pay serious attention to the sun, but sceptics cannot afford not to do so.
----------------
Is there a Ni ±o in our near future?
There are indications of increases in the body of warm water in the Western Pacific. Some insist a Super Ni ±o is in the cards with elements comparable to 1997/1998; others doubt that such would be the case during a cool PDO phase. An early discussion is taking place on the WUWT blog.
In concert with this, Bob Tisdale presents a graphic explanation (part 1) of the formation a new "El Ni ±o" in the form of a time series of vertical profiles along the W-E strike.
~~~~~~~~~~~~~~~~~~~~~~~~~~~~~~~~~~~~~~~~
CliSci # 163 2014-03-30
Dr. Tim Ball on climate models
"IPCC Scientists knew data and science inadequacies contradicted certainties presented to media, public and politicians, but remained silent".
Dr Tim Ball has an essay in WUWT that traces the IPCC 's use of models back to its beginnings when the late Stephen Schneider - one of its early forceful supporters - who you may remember from statements that justified scary scenarios and dramatic statements while suppressing doubts - allowed: Uncertainty about feedback mechanisms is one reason why the ultimate goal of climate modeling forecasting reliably the future of key variables such as temperature and rainfall patterns is not realizable.
A large part of the essay deals with Chapter 8 of the 2007 IPCC AR4 report in which "Advances in Modelling" are discussed.
Also, you should scroll down to a comment by geologist Dr Norman Page (March 21, 2014 at 6:48 am) who sums up a series of posts from his website that deal with "forecasts of a likely coming cooling based on using 60 and 1000 year periodicities in temperature data and neutron [and 10Be] counts as the best proxy for solar activity".
Suffice it to say that Dr Page does not use models.
Finally, Dr Roy Clark has written a piece about the Failure of Climate Models, originally as a comment on a piece by David Whitehorse in WUWT (26/3 at 10:01 pm) and republished in Yahoo 's 'ClimateSceptics Forum '.
Clark 's point is that much of the model simulation is based on Manabe and Wetherald (1967) which approach suffers from a number of questionable assumptions.
Sea Level and the Pause
In another IPCC-compliant paper, Anny Cazenave and her French co-authors write in Nature Climate Changethat present day sea level rise is a major indicator of climate change. She goes back to 1990 when, she says, it was ~ 3.1 mm/yr, but the last decade has shown a slowdown by 30%, coinciding with the temperature "pause". They find that when they just take the ENSO effect out of the time series, the slowdown of the SL increase disappears. They blame a succession of La Ni ±a periods over the last few years for the slowdown, ignoring the fact that this is not primarily an ENSO item at all, but the expected phase change of the Pacific Decadal Oscillation after the 1975-2005 warming phase. These PDO and AMO oscillations are probably solar related and their 60 year cycle has affected the slow temperature rise since the end of the LIA, concomitant with SL rise.
This is all apart from the fact that there always have been problems with satellite altimeter-derived measurements (Jason-Topex-Poseidon) and their adjustments and corrections and that the quoted ~ 3.1 mm/yr from these sources does not match actual, carefully vetted tide gauge records. These indicate a 20 cm rise over 120 years, or close to the more acceptable (outside the IPCC), often quoted ~ 1.8 mm/yr.
Once one starts this kind of work it would be better to look for the basic forces involved in the "anomalies" with which the oceans present us. A more interesting line of research would be the correspondence between Pacific Ocean Sea Surface Temperature and Solar Cycle Deceleration. The latter is explained HERE in short. In this field it helps if you read Russian. I don 't.
It 's official: Polar Bears alive and well.
Much ice may have passed under their feet, but the Polar Bear has finally been restored to good health, not threatened by disappearance because of ice availability and declining birthrate. The Polar Bear Species Group (PBSG) of the IUCN 's Species Survivor Commission has admitted that its 2006 population report - on which so much of the Polar Bear hype and the ESA 's "Threatened" warning were based - was faulty.
See <http://polarbearscience.com/> , but don 't miss the picture of a perplexed Polar Bear HERE .
-------------------
IPCC's AR5, WG II: Muting the Alarm on Impact
In an Opinion Piece in the Wall Street Journal UK Politician Matt Ridley gives his opinion on the soon to be released Impact portion of the IPCC 's AR 5 report. It is a balanced review that illustrates how much the IPCC has changed since the 2007 AR4.
In the same vein, Der Spiegel reports:
About the wider subject of AGW-related extinctions, the UN IPCC now says it is no longer so certain. The second part of the IPCC 's new assessment report is due to be presented next Monday in Yokohama, Japan. On the one hand, a classified draft of the report notes that a further increased extinction risk for a substantial number of species during and beyond the 21st century is to be expected. On the other hand, the IPCC admits that there is no evidence climate change has led to even a single species becoming extinct thus far.
-------------------
A Changing Climate, a round-up
You wouldn 't know it from your daily MSM paper, but 2014 is turning out to be the year that rings the bell on the credibility of the IPCC 's project.
On the science side:
* The sensitivity to CO2 increases on climate - judged exaggerated by critics for years - is now being lowered by the IPCC itself.
* The non-correlation between CO2 increases and a stable so-called global mean temperature over more than 15 years is being widely recognised as degrading the concept of averaging a multitude of defective models. Parliamentary enquiries are starting to look at the value of the UN Panel 's model-based projections.
* A flood of Panel-inspired papers in the stable of IPCC-enslaved periodicals, offering far-sought rationalisations of this "plateau" or "pause" and embroidering on fanciful ecological impact issues, is making a mockery of IPCC-sponsored research, while Sra Figueres (Exec.Secr. UNFCCC) makes jubilant exertions to the contrary in the address to WG 2 's ("Impact") opening meeting.
* Governments and scientists have been openly criticising the Panel for its unscientific, even undemocratic working methods.
It has been accused of ignoring long-standing standards of scientific discipline and method for political purposes.
On the political/economic side:
* The national economic problems of the last number of years have increased awareness of the subsidy cost of the mitigation programs, to individual industrial producers, to citizens ' power and fuel bills and to national economies. Manufacturers are migrating to more relaxed jurisdictions. Subsidies to "renewable" power projects are being terminated and producers of such are going bankrupt. Power bills are noticeably increasing. Essential manufacturers are moving to Asia or close down.
* The European Union, having been in the forefront of the mitigation/abatement industry and being poor in locally developed hydrocarbons are hardest hit. Germany has developed an extensive wind-turbine park and major changes and extensions to the concomitant switching and distribution network, finding its "green power" annoyingly unpredictable and is banking on its back-up of dirty "Braunkohl" power stations and imported gas. Now, biofuels' are largely being rejected also (and rightly so).
* Unfortunately, at this time, Mr Putin threw a monkey wrench into the machinery with his imperial adventure in the Crimea. While some countries are not so dependent on Russian gas, much of Eastern and Southern Europe is. Strong economic punishment, as considered some of the G7 nations, does not find full support by the latter. Putin has them over a barrel.
* As a result, battles on CAGW - such as they were - have been displaced by battles on fracking ' and the development of shale gas, but there are NIMBY forces to be conquered. Beyond that, there may or may not be LNG from North America.
* The EU Commission is slowly abandoning its 'carbon targets ', leaving the Obama administration and its infernal EPA as one of the few powers to support failed science and a failed policy. Even the UN reports are thought to be taking a softer line.
* The UK has backed the UN Panel since the days of Tony Blair. It has seen the consequences for its economy, employment, living standard and industrial capacity affected. It may find some solace in shale gas, but the capital cost of the extended wind-farm turbine fields weighs heavily on the economy and on its shivering citizens.
The average unemployment level in Europe is 12%, twice that of the US (BBCworld 26/3).
From the point of view of a sceptical scientist this change in "climate" will be seen with mixed feelings. 2014 marks the breakdown of international gullibility.
The battle on faulty science is about to be buried under the mud flow of economic and political influences, as the perpetrators of the destruction as science-as-we-know-it will be forgotten. Meanwhile the wasteful show of the IPCC 's untold WG2&3 billions, propelled by UNEP and it offspring, will continue in only slightly amended form under another circus tent.
~~~~~~~~~~~~~~~~~~~~~~~~~~~~~~~~~~~~~~~~
CliSci # 162 2014-03-20
What a long US Temp time series of "extremes" tells us about UHI.
WUWT reader Greg Kent has been looking at a newly released NOAA/NCDC Daily Weather Record series for the US, based on on 424 well-controlled stations over the entire 20th century. Individual TMax and TMin records can be plotted, resulting in some interesting charts.
The year with the most record high temperatures was 1936. The next few hottest years were also in the 1930s. Analyzing the 15 years with the most high temperature records shows that every single one of them occurs before the era of global warming began in the 1970s. The more recent years, which are supposed to have been particularly extreme, are dwarfed by the number of records set in 1911, 1925, and 1930s. Using a century-long scale makes recent years look neither particularly hot nor extreme.
The data also shows that there has been a reduction in the number of record lows in recent decades, especially in the winter months.
All this is a first attempt to dig some meaning from a large number of newly displayed data.
WUWT reader Paul Homewood looks at the same data and digs a little further. He notes that UHI influences are generally not accounted for and his figures 4 and 5 show the stark difference between urban and rural areas.
He notes: "So NCAR admit that much of the warming has occurred at night, and believe that this is caused by climate change . The evidence from the Southeast suggests that this is not the case, and that night time warming is largely the result of UHI.
[.....]
Clearly, a lot more work needs doing, but this exercise suggests a lot of serious questions need to be asked about the true impact of the Urban Heat Island effect."
Solar forcing, the North Atlantic and the LIA
In an online letter in Nature Geoscience, Moffa-S ¡nchez et al describe a reconstruction of thermocline temperature and salinity in the Northern Atlantic in the period 818 to 1780, using δ18O and Mg /Ca ratio from foraminifera shells from sediment cores. They report that the centennial scale hydrography correlates with the variability of Total Solar Irradiance, and "infer that the hydrographic changes probably reflect variability in the strength of the subpolar gyre associated with changes in atmospheric circulation. Specifically, in the simulation, low solar irradiance promotes the development of frequent and persistent atmospheric blocking events, in which a quasi-stationary high-pressure system in the eastern North Atlantic modifies the flow of the westerly winds. [They] conclude that this process could have contributed to the consecutive cold winters documented in Europe during the Little Ice Age."
Not unlike Marcel Leroux ' MPHs blocking the zonal flow, I think.
Curiously, Leroux is not listed among the 30 references.....
WUWT abandons a solar connection
Sverre Holm (Dept of Informatics, U. of Oslo) has a paper out entitled On the alleged coherence between the global temperature and the sun 's movement in which he comes to the conclusion that Scafetta 's claims of solar periodicities do not stand the test of Holm 's spectral analyses.
This work seems pretty far removed from the realities of actual observations, and it ignores a body of SIM/climate work that runs from Jos , 50 years ago, through Landscheidt, Fairbridge, Mackey, Niroma, Charvatova, Wilson, Hung and others to the work of Nicola Scafetta, which the author questions. It also ignores the input of data on the activities of the dual solar magnetic field.
However, it seems that this narrow statistics study provides Anthony Watts the opportunity to state: "Looks to me like game over for claims of Barycentrism controlling Earth 's climate. Clearly this was a case of pulling a signal from noise that is just an artifact of the process, much like Mann 's special brand of math ........".
And later: "Oh, people will still debate it I 'm sure. Tallbloke and his group of cyclists will try to prop it up, but I 'd say it pretty much has reached the end of credulity as a workable theory.
Some years ago I thought the theory had some merit, and I dabbled with it a bit, but then just like with CAGW, things didn 't quite add up. Now I 'm quite convinced it 's junk. Anthony"
A number of his bloggers are not buying it.
And, as Anthony foresaw: Tallbloke takes him up on the challenge and puts in a plug or two for the omnipresent 60 year cycle that is recognised widely.
While Anthony Watts has never been an enthusiastic supporter of extra-terrestrial causes of climate changes on the planets, he must have had a particularly bad day .....
Actually, there is probably a more substantive body of observations in astronomy and astrophysics that - in combination with significant isotope studies in paleoclimatology - lends itself to climate cycle interpretation than there is in the minutiae of physics of the atmosphere. It is also one that has predictive qualities. Come to think of it, there is even less scientific proof for the CAGW hypothesis of CO2 that half the world "believes" in, than there is for solar direct and indirect solar influences on climate.
As for solar gravity and magnetics matters and the whole question of the electric heliosphere, we have recognised many of the elements, but the mechanism still escapes us. We are progressing. Slowly.
Ross McKitrick 's initiative
Ross is launching an environmental initiative in Canada and Andrew Montford 's blog 'bishop-hill' will tell you all about it.
Ross will also be the speaker at the Friends of Science 's Eleventh Annual Luncheon in Calgary on May 13th. This link will take you to the FoS webpage where you can order your tickets.
AMO held to be dominant climate factor
Petr Chylek et al have a letter in GRL of which the key points are that
* the Atlantic Multidecadal Oscillation is a more effective predictor than ENSO for global mean temperature (I think we already knew that),
* that AMO-related processes contribute about on third to the post-1975 Global Warming and
* that radiative forcing due to volcanic aerosol is already encoded in the AMO.
I suppose that he chooses AMO as the important mover, because the PDO to which we usually look for the sixty year climate cycle, lags the AMO by some twelve years.
Bob Tisdale in WUWT does not like Chylek's ignoring the PDO and his treating the ENSO as noise, instead of process.
But we are getting much closer to the cause than guessing about an aerosol vs Greenhouse balance?
And Eschenbach (also in WUWT) dismisses the Chylek paper as imitating Ouroboros.
Pathetic display by the AAAS
The American Association for the Advancement of Science must have run out of arguments. A panel of thirteen has seen fit to put their names on a 20 page piece of propaganda "WHAT WE KNOW: THE REALITY, RISKS AND RESPONSE TO CLIMATE CHANGE". that shames its banner name of scientific advancement. Has this organisation with its once reputable Science periodical allowed itself to become the unquestioning mouthpiece for IPCC politicised indoctrination?
See also Michaels& Knappenberger at WUWT: AAAS 's Guide to Climate Alarmism.
Nothing new about Polar blasts
Towards the end of the 1940-1975 cold period NOAA/NWS meteorologist A. James Wagner published a paper on the severe winter of '76/ '77 and pretty well describes what the Eastern US and Canada have been going through more recently. He also goes back 60 years to parallels to the previous such occurrence, the winter of 1917/18.
The sixty year oceanic oscillation cycle was not much talked about in those days, but many of us have seen the present "pause" coming.
It is no surprise though, that the greenish CBC News sees fit to report on a 2012 study by Jennifer Francis of Rutgers University, that claims that "Cold snaps [are the] result of Global Warming". Hey, would that then include the 1885-1920 cooling also?
Der Geist der stets verneint (attrib. Mephistopheles, "The spirit that ever denies")
SciAm loves Michael Mann; if anything, he is consistent.
Never mind the plateau: "Earth will Cross the Climate Danger Threshold by 2036" (Scientific American news V 310, #4. Mar 18)5
~~~~~~~~~~~~~~~~~~~~~~~~~~~~~~~~~~~~~~~
CliSci #161 2014-03-10
161 2014-03-10
Ten reasons for the "hiatus"
Seems that every issue of CliSci can count on one or more new explanations from the Warmist community for the hiatus. Anthony Watts has been keeping score and has just added the faithful 's tenth reason for the hiatus/plateau/pause/standstill of the last 15+ years.
Guess what? Lead warmist apologist Gavin Schmidt, who is the author of # 10, says in Nature that Coincidence, conspired to dampen warming trends . Did the dog eat his homework?
Andrew Montford has some fun in the Bishop-Hill blog with this convergence of unfortunate circumstances, Schmidt 's "mind-boggling coincidence hypothesis".
The BBC chimes in:
Researchers from the University of East Anglia have discovered evidence of four new gases that can destroy ozone and are getting into the atmosphere from as yet unidentified sources.
Scientists have identified four new man-made gases that are contributing to the depletion of the ozone layer. Two of the gases are accumulating at a rate that is causing concern among researchers.
(Remember H.L.Mencken and the Hobgoblins).
Climate Sensitivity and the IPCC
Over the course of the past decades the sensitivity of Global Mean Surface Temperature to "a doubling of CO2" (based on the pre-industrial 280 ppm level) has been a main point of contention, ranging from zero (an extreme position which we do not support) to highs of 6 degrees Celsius, a number which stretches an already large dose of imagination. Discussions in the blogosphere have been frequent and fruitless. In various publications debates have been going on about such topics the earth radiation budget and the positive vs. negative feedback of cloud systems, but items like the logarithmic relationship that limits the ability of the CO2 molecule to absorb additional heat in its frequency spectrum from radiant heat flow are routinely ignored by the ICC's advocates. A good overview is given by Ken Gregory on the FoS website, which shows how the satellite-based Earth Radiation Budget Experiment (ERBE) turns the IPCC 's positive feedback into a negative one.
The Global Warming Policy Foundation has now also published a Report, entitled "Oversensitve", by Nick Lewis and Marcel Crok that shows that the best observational evidence indicates our climate to be considerably less sensitive to greenhouse gases than climate models are estimating. It includes a foreword by Dr Judith Curry. The report is in a short version (37 pp.) and a long version (65 pp.). It points to the IPCC not coming clean with respect to conclusions it has also reached itself.
This is also the line taken by WUWT: "What the IPCC knew, but did not tell us" in an article by Pat Michaels and Chip Knappenberger.
Good News from the Jungle
James Delingpole writes on Breitbart on the sequel to court fights that resulted from a Texaco oil spill that occurred well over twenty years ago in the jungles of Ecuador. Texaco was bought by Chevron and Chevron inherited a basket of claims, and with it a jungle of corrupt government officials, corrupt courts, a bevy of greedy ambulance chasers, lying lawyers and corrupt consultants, all trying to get a piece of the $ 9.5 billion environmental fine that was at stake.
Many oil companies are known to appease such "greenmail" masquerading as Environmentalism, often in the interest of peace with their customer base. To its credit, Chevron stood up to the bullying, faced the crowd, proved the case to be fraudulent and won on appeal. As if it would only have been so simple. Read Delingpole 's story yourself.
A solar link with the "Blocking Highs"?
The Forbush effect ( la Svensmark) refers principally to "solar wind" changes . It is an occasional decrease in the intensity of cosmic rays, attributed to magnetic effects produced by solar flares. The intensity of galactic cosmic rays (GCRs) reaching Earth is inversely correlated with the 11-year solar cycle of sunspot activity. At maximum solar activity, stronger magnetic fields are carried out into interplanetary space by the solar wind, and these fields block the cosmic rays (adapted from Enc.Brit.). Svensmark correlates this effect with nucleation changes in the ionosphere which contributes to variation in cloud formation, causing a negative feedback to any warming.
A new paper (in press) by St Petersburg 's Artamonova & Veretenenko hold that tropospheric pressure variations are possibly linked to Forbush decreases of GCRs.
In their conclusion, the authors state:
"Most pronounced pressure deviations are associated with climatic Arctic/Antarctic and Polar fronts, which are the regions of intensive cyclonic activity. According to the weather chart analysis, the detected pressure increases are due to the weakening of cyclones and intensification of anticyclones at extratropical latitudes in both hemispheres associated with Forbush decreases under study. The obtained results suggest that variations of galactic cosmic rays may influence dynamic processes at middle latitudes, so they may be considered as an important link between solar activity and the lower atmosphere."
Anything to do with THIS ?
Some interesting comments in Tallbloke 's Talkshop
----------------------
Rumblings from across the Pond
Located in a park on the outskirts of Utrecht, the Royal Netherlands Meteorological Institute (KNMI) is known worldwide for its scientific abilities and its historical and current files of atmospheric data. Nevertheless, it has faithfully followed the political edicts of government imposed compliance with the IPCC 's versions of climate change, while carrying on unofficial discussions with the group of Dutch sceptics.
In the face of much public criticism about the Fifth Assessment Report and its methodology, the IPCC had asked various governments to submit comments on whether and how the IPCC could improve its performance. I do not know what the other compliant governments submitted as a response, but the Dutch response has been published by the KNMI and can be accessed HERE. It is short and "frank". The Dutch have never been known to hide their light under a bushel (as your editor can testify), and their submission 's findings are in tune with those by Donna Laframboise 's (2011) Delinquent Teenager; she is not Dutch, but doesn 't hide anything either. Yet, what is important is that here is a member government giving them hell.
In addition to all this, Emeritus Professor (TU, Eindhoven) Dr Dick Thoenes has written a piece in a Dutch e-journal which tears down the modis operandi of the Panel and concludes that it is guilty of Subversion of Democracy.
~~~~~~~~~~~~~~~~~~~~~~~~~~~~~~~~~~~~~~~~
CliSci # 160 2014-02-28
Climate Prophets and Profiteers
Not about science, but this article in the Wall Street Journal is not to be missed.
HadCRUT bias on Temperature trends
This paper by Cowtan and Way insists that lack of data points in places like oceans and deserts introduces a bias in CRU temperature trends. The authors offer two new interpretations to cover the gaps, one by an optimal interpolation algorithm, the other from additional satellite data. Their conclusion:
"Temperature trends are compared for the hybrid global temperature reconstruction and the raw HadCRUT4 data. The widely quoted trend since 1997 in the hybrid global reconstruction is two and a half times greater than the corresponding trend in the coverage- biased HadCRUT4 data. Coverage bias causes a cool bias in recent temperatures relative to the late 1990s, which increases from around 1998 to the present. Trends starting in 1997 or 1998 are particularly biased with respect to the global trend. The issue is exacerbated by the strong El Ni ±o event of 1997 1998, which also tends to suppress trends starting during those years."
In Nature Geoscience 7, Judith Curry examines the validity of the approach and gives it a partial approval, but Bob Tisdale is not so charitable on his own blog (nor is Steve McIntyre) and concludes a second post in WUWT by stating as follows:
"The Cowtan and Way (2013) revisions to the HADCRUT4 data do nothing to explain the absence of warming that is occurring in the non-polar regions during the hiatus period. Those non-polar regions cover about 90% of the planet and it 's there that climate models cannot explain the slowdown and absence of warming. The Cowtan and Way revisions also exaggerate the warming at the poles which further undermines the current generation of climate models, because the models are unable to explain the observed warming at the poles. That is, the models are still not capable of properly simulating polar amplification.
Those who promote the Cowtan and Way (2013) revisions to the HADCRUT4 data don 't understand where the hiatus is taking place and they don 't understand the model failings at simulating polar amplification or they are intentionally being misleading."
Solar Cycle 24
The course of SC 24 from NASA 's Hathaway and Watts ' solar reference pages.
Dr. Patrick Moore before the US Senate Environment Committee
The co-founder and 15 year leader of Greenpeace left when the group turned sharply left and acquired policies that conflicted with his scientific convictions. While present day Greenpeace attempts to wipe him from their record, Watson is not hiding his anti-CAGW views. On February 25th he addressed the US Senate Subcommittee in an expert witness testimony.
He deals with the IPCC 's position from the point of view of ecology and paleoclimates of the geologic record and remarks that dangers of lower ice age temperatures are a greater threat to humanity than warming. After all, he says, "...humans are a tropical species", that evolved near the equator. A measured presentation, understandable even for politicians.
Volcanoes and the "hiatus"
A Livermore/MIT/GISS group, which includes such well known CAGW luminaries as Ben Santer, Susan Solomon and Gavin Schmidt, has published a study in Nature Geoscience in which volcanic aerosols are said to contribute to decadal changes in tropospheric temperature. This idea is supported by ....... modelling studies. An overview is given by WUWT and the comments are as expected. In a subsequent WUWT post, Eschenbach makes some calculations and cuts the story to pieces.
I have yet to see any influence of volcanic eruptions on climate, other than those of the very rare super-volcanic events that had more than a week 's influence on global temperatures.
In a subsequent issue of Nature Geoscience Gavin Schmidt et al proclaim that "Climate models projected stronger warming over the past 15 years than has been seen in observations. Conspiring factors of errors in volcanic and solar inputs, representations of aerosols, and El Ni ±o evolution, may explain most of the discrepancy."
Meanwhile the Editorial in that same issue states meekly that "The recent slow-down in the rate of warming, averaged over the surface of the entire planet, has incited much discussion. As climate scientists are tracking down the causes, we must not forget that average surface temperatures are only one indicator of climate change".
-----------------------
Convulsions in the warmist community
Four years ago Nature started a journal called Nature Climate Science, with great expectations for an open discussion of relevant problems in climate science. It was not to be. I skimmed through the mag for a couple of years and rarely found in it anything that had a critical view of the establishment dogma.
The faithful are getting very nervous. Even the MSM is now talking abut "the Pause". There are a number of rationales for sale here to explain the lack of warming. None of them hold much water.
I thought I would present for your interest and possible amusement the index page (with clickable links to at least the Abstracts and some shorter articles and letters) of the March 2014 Volume 4, #3 issue.
If you have read Patrick Watson above, you 'll agree he does a better job of it.
Cause of the UK floods
The Somerset floods in Britain have been blamed on natural hazards, politicians, budgets, faulty communications, local councils and everyone else. Early on rumours circulated that local councils had fallen for the EU Environment 's ecology policies.
The smoke begins to clear (I wish I could say the water has begun to drop) and Christopher Brooker points to the main culprit in an article in the Telegraph from which:
"The smoking guns begin with a policy decision announced in 2005 by Labour 's floods minister Elliot Morley, later to be jailed for fraudulently claiming more than £30,000 on his MP 's expenses. Under the heading Saving wetland habitats: more money for key sites , Morley directed that, to comply with the EU 's habitats directive and a part-EU-funded study involving the Royal Society for the Protection of Birds, the WWF and the Environment Agency, flooding in Somerset should be artificially promoted, because wildlife will benefit from increased water levels . The 13 local drainage boards, responsible for keeping the Levels properly managed, were all to be co-opted into implementing this policy."
Kerry in Indonesia
US Secretary of State John Kerry made some rather nonsensical statements on climate change ("a weapon of mass destruction" among others), when on a visit in Indonesia. A Press Release by Friends of Science takes him to task.
Belated discovery
It seems that, beset by criticism of its atmospheric models, the modelling crowd (Gavin Schmidt and seventeen co-authors) have been looking at paleoclimate data to improve the methodologies used to produce their latest 'new and improved' version, the Coupled Model Intercomparison Project phase 5 (CMIP5) models.
Now, as a geologist I can only appreciate this belated and partial awakening.
They find that they can "demonstrate that there is a strong potential for the palaeo-climate simulations to help inform the future projections and urge all the modelling groups to complete this subset of the CMIP5 runs".
Still simulations, though. The thirty page paper in Climate of the Past is on open access at <www.clim-past.net/10/221/2014/>
~~~~~~~~~~~~~~~~~~~~~~~~~~~~~~~~~~~~~~~~
CliSci # 159 2014-02-20
More about the death of the PRP: The thought-police at work
In CliSci # 154 I drew your attention to a series of 12 papers by well-known sceptics in a Special Issue of a new periodical "Pattern Recognition in Physics" which had been launched by the publisher Copernicus. In CliSci # 156 I had to tell you that the new magazine had been killed. Publisher Martin Rasmussen has offered a number of weak excuses as to why this was necessary, but Pierre Gosselin will not have any of what he calls weak sophisms and believes that political pressure was applied. One of the authors of PRP papers quotes the ClimateGate e-mail correspondence at the time (2003) of the Soon/Baliunas paper which had offered - with worldwide paleoclimatological evidence - that Michael Mann 's theory - that the MWP was just a local NH event - was wrong.
Messing with the input data
To put it rather coarsely: If the models do not fit the data, then the data must be changed.
It may well have been written in the IPCC rulebook.
From the earliest days the IPCC has been suspected of manipulating the computer input data to achieve results that satisfied the UN policy. Early mention of this was in the field of surface temperature measurement, a field that allows for adjustments and corrections of elevation, humidity, wind, location, UHI, as well of the integration of long extrapolation from coastal data into the 70% of the globe that is covered by oceans. Much of this was exposed by Essex & McKitrick in "Taken by Storm" (2002). They created the fearsome T ° Rex who terrorised the warming graphs. "T" was not to be trusted. UAH and RSS satellite data improved this to a large extent, but pre-satellite (1970s and earlier) surface data remained fair game for trendologists. In fact "Global Mean Surface Temperature", changes in which are carefully monitored by politicians and media, is a computer construct.
Sea level measurements were also a useful target: With subducting or spreading continental margin tide stations rejected, coastal stations that had been stable for centuries were also largely abandoned in favour of satellite data. Several vintages of satellite monitor instruments later, we are still subject to many adjustments and corrections from satellite orbit degeneration to sea surface disturbances and from oceanic pooling to currents and down/upwellings. Global mean sea level on which SL rise is measured by millimetres is a figment of computer brains, not measurable reality.
It has been said that the "anomalies" observed from the data are smaller than the corrections applied to the raw data.
Today the IPCC is facing another conundrum, that of a 17 year lack of warming while CO2 emissions grow unabatedly. As the increasing CO2 is supposedly responsible for creating continuing global warming, the cry is: "Where has the heat gone". They seek it here, they seek it there, they seek it everywhere (with apologies to Baroness Orczy). May-be it was hiding in the deep of the oceans? The public (let alone colleague scientists) did not take well to that one: lighter warmer water hiding under thousands of feet of cold water? Didn 't make sense. Today we have a new vehicle for the fable.
Watts reports that the "historical and plot of Total Solar Irradiance (U.Colorado SORCE web page) has been tinkered with again", resulting in drops in the Maunder Minimum and in the current Solar Cycle 24. In the background is the interruption of acquisition of data when the Challenger shuttle blew up. It created a data gap, the "ACRIM gap" of 1989-1992, which required a recalibration and adjustments.
Two interpretations exist of the intermediate years, which - unfortunately - was an interval in which an anomalous event happened. One is a theoretical solution, the other a proxy-based one.
Scafetta and Willson (click for their pre-publ. PDF) have examined the process ("ACRIM TSI satellite composite validation vs.proxy models") and disagree with four aspects of the earlier Fr ¶hlich/Lean revision. They conclude: "The implications of increasing TSI during the global warming of the last two decades of the 20th century are that solar forcing of climate change may be a significantly larger factor than represented in the CMIP5 general circulation climate models."
Not what the IPCC was looking for.
Concludes the WUWT post: Not only is global temperature adjusted and is a constantly moving target, now so it is with solar irradiance. With so much input data in flux, the uncertainty monster of climate modeling output keeps growing.
Klyashtorin would have enjoyed this
While Canadian Fisheries officials seemed to have been taken unaware at the time of the "disappearance" of cod on the East Coast and attempted to ward off disaster with quota fiddling, Russian Government researchers like Klyashtorin (2007) and Gary Sharp at CC/ORS in California connect the movement of fish stocks to cycles of climate change, in particular the Pacific oscillations. (Click above for the Russian's landmark paper). In fact, the earliest work on this dates back to an AMS paper by Nathan Mantus in 1997.
In the Seattle Times it is now reported that Chinook salmon returns this year will be as large as any since 1938.
NOAA/Fisheries ' office in Seattle (NWFSC) has published a paper which explains the relationship between the PDO and the Salmon run. In its side margin there are references to their predictive species runs.
(h/t Ken Schlichte)
Stadium Wave is propagating
Recall Marcia Wyatt and Judith Curry 's creation of the hypothesis of the Stadium Climate wave, which propagates itself around the ... eh,... globe, or at least the NH? It now has its own website. See what you have been missing.
-------------------
Extreme Weather
Benny Peiser 's CCNet carried the following item from the Daily Mail:
"One of the Met Office 's most senior experts yesterday made a dramatic intervention in the climate change debate by insisting there is no link between the storms that have battered Britain and global warming. Mat Collins, a Professor in climate systems at Exeter University, said the storms have been driven by the jet stream the high-speed current of air that girdles the globe which has been stuck ' farther south than usual. Professor Collins told The Mail on Sunday: There is no evidence that global warming can cause the jet stream to get stuck in the way it has this winter. If this is due to climate change, it is outside our knowledge. ' --David Rose, Mail on Sunday, 16 February 2014 ".
(Also at WUWT )
Now, I am grateful that Professor Collins has delinked the storms from Global Warming, particularly as there hasn 't been any for 17 years, a fact his employer has already acknowledged. But to imply that the apparent increase of NH storms and low temperatures is not related to climate change but just to the JetStream happening to be farther south than usual, and not to take account of the reasons why such a shift would be happening, is like doing science with the blinders on.
The UK MET, as providers to the IPCC effort, keep ignoring the obvious changes in solar total irradiation at their peril, something Piers Corbyn is happy to point out. With the influences of the links to solar wind and orbital oscillations as yet only half explained, no scientist should dismiss alternatives as being "outside our knowledge".
I am thinking that the root of what we see happening in today 's weather is to be found in the explanation of the changed behaviour of the rotating towering pressure systems at the top of our planet, which quite possibly do not have an earthly explanation, but could be related to the electric heliosphere/solar magnetic field changes and orbital factors like the earth ' precession and axial variations. They - at present - are playing havoc with the normal zonal flow and the location of the jet stream through the polar vortices which the MSM seem to have discovered recently and which the meteorologists have trouble explaining. In fact, if this would keep going on as long as some astrophysicists appear to think it might, it will be a good example of Climate Change, only not of the type the IPCC is pushing.
Science has wasted many years in not devoting itself to an understanding of the interplay of these forces. It is only now beginning, but there appears to be no one like a UN granddaddy funding it.
An new article by Vavrus in GRL gives the latest on the IPCC 's Coupled Model Intercomparison Project 5 (CMIP5) simulations involving Arctic cyclones of the last 150 years and states in it Abstract:
"Increasing attention is being paid to extreme weather, including recent high-profile events involving very destructive cyclones. In summer 2012, a historically powerful cyclone traversed the Arctic, a region experiencing rapid warming and dramatic loss of ice and snow cover. This study addresses whether such powerful storms are an emerging expression of anthropogenic climate change by investigating simulated extreme Arctic cyclones during the historical period (1850 2005) among global climate models in the Coupled Model Intercomparison Project 5 (CMIP5) archive. These general circulation models are able to simulate extreme pressures associated with strong polar storms without a significant dependence on model resolution. The models display realism by generating extreme Arctic storms primarily around subpolar cyclone regions (Aleutian and Icelandic) and preferentially during winter. Simulated secular trends in Arctic mean sea level pressure and extreme cyclones are equivocal; both indicate increasing storminess in some regions, but the magnitude of changes to date are modest compared with future projections."
.... and the Comments on WUWT rip it to shreds.
~~~~~~~~~~~~~~~~~~~~~~~~~~~~~~~~~~~~~~~~
CliSci # 158 2014-02-10
More about vortices
Two posts (Febr. 1st and 8th) from the "justthefacts" attic of the WUWT home look at the Northern earth rotation pole in winter, and present the complicated story of the causes of Displaced Polar Vortices. When the choir of commentators join in, things become too confusing for your reporter. See HERE and HERE . The second of these hyperlinks is actually a good introduction and summary of Polar Vortices, including the vertical profile of this feature. (Those sensitive to the mixing of Imperial and SI systems of measurement may want to hold their noses by the mention of kilofeet .)
Last time we looked, Leroux 's Mobile Polar High had now become a large Low, properly rotating counter-clockwise, and accompanied by one or more Highs usually of smaller size, with the corresponding outbreaks, coriolis-affected, barreling down on the lower latitudes.
The present post quotes work by Mitchell which deals with stratospheric vortices and maintains that a new classification of such vortex events has implications for tropospheric patterns.
In the discussion a half dozen more elements get brought in as "causes", from "the Sun, stupid" (Svalgaard says "Nyet") to Rossby waves, the earth ' axis tilt and the moon.
Tertiary microfossils connect orbital cycles to climate
Go back to the end of the rather warm Miocene Climate Optimum some 15 million years ago to find the start of a general cooling. In an article in Paleoceanography V.28/4 by Holbourn et al δ13C and 18O signals from foraminiferea of Western Pacific sediments (ODP core 1146, S.China Sea) have been used to correlate with - respectively - the long eccentricity (400 kyr) and with the "short" eccentricity (100 kyr) and obliquity (41 kyr) of Milankovitch fame. There is no mention of the 21 kyr precession cycle.
Polar ice started to appear and after ten million years the first full-blown glacial periods marked the beginning of the Pleistocene. The study deals in detail with the period 10.9 to 10.5 Ma, the Miocene/Pliocene boundary period. The main period examined covers 4 million years, but they also use data to 8 million years (16.4 to 8.4 Ma).
The question remains whether Tertiary plate tectonics would not play a significant role in such large periods as well.
Abstract:
We present high-resolution (2 3 kyr) benthic foraminiferal stable isotopes in a continuous, well-preserved sedimentary archive from the West Pacific Ocean (Ocean Drilling Program Site 1146), which track climate evolution in unprecedented resolution over the period 12.9 to 8.4 Ma. We developed an astronomically tuned chronology over this interval and integrated our new records with published isotope data from the same location to reconstruct long-term climate and ocean circulation development between 16.4 and 8.4 Ma. This extended perspective reveals that the long eccentricity (400 kyr) cycle is prominently encoded in the 13C signal over most of the record, reflecting long-term fluctuations in the carbon cycle. The 18O signal closely follows variations in short eccentricity (100 kyr) and obliquity (41 kyr). In particular, the obliquity cycle is prominent from ~14.6 to 14.1 Ma and from ~9.8 to 9.2 Ma, when high-amplitude variability in obliquity is congruent with low-amplitude variability in short eccentricity. The 18O curve is additionally characterized by a series of incremental steps at ~14.6, 13.9, 13.1, 10.6, 9.9, and 9.0 Ma, which we attribute to progressive deep water cooling and/or glaciation episodes following the end of the Miocene climatic optimum. On the basis of 18O amplitudes, we find that climate variability decreased substantially after ~13 Ma, except for a remarkable warming episode at ~10.8 10.7 Ma at peak insolation during eccentricity maxima (100 and 400 kyr). This transient warming, associated with a massive negative carbon isotope shift, is reminiscent of intense global warming events at eccentricity maxima during the Miocene climatic optimum.
One of the main charts of the paper appears HERE in WUWT
-----------------
The IPCC shifts the battle ground again
In a guest essay in WUWT Dr Tim Ball points out that the political IPCC, having been losing the battles on a Global Warming that has stopped and on Climate Change that is being accepted as normal, is now focusing its PR campaign on CO2 as a "pollutant".
In the discussion, the question comes up as to how the IPCC managed to have brought all the professional associations APS, AIP, ACS, AGU, RS into line and one is referred to a 2008 paper by Richard Lindzen (updated 2012): "Climate Science: Is it currently designed to answer questions?", which is worth reading for its historic accuracy and completeness.
Steyn vs. Mann
As the MSM are not reporting it, I may as well be the one to give you the opportunity HERE .
~~~~~~~~~~~~~~~~~~~~~~~~~~~~~~~~~~~~~~~
CliSci # 157 2014-01-30
AR5 hearings by UK Commons committee on YouTube
The three hour video of the January 28 hearing is now on YouTube:
<http://www.youtube.com/watch?feature=player_embedded&v=6GzNATrGH7I>
There are some instant comments by WUWT readers on the session. The Warm side is confused, Lindzen (@1hr 40min) is great and dominates the discussion, and Donna (after 1hr49) is in good form, gets bullied in the last ten minutes; Nick Lewis is less than effective and Chairman Yeo is at a loss.
Read the comments from those in the UK who could watch it live. Those outside were frozen out, unless you have a VPN server. There are some other ways in web sources and Judith Curry has published pieces of transcripts and also gives links to other blog comments.
-------------------
The Deliberate Corruption of Climate Science
This the title of Tim Ball 's book, just out, that ranges far and wide over the subject in the history, politics, machinations and science of this and similar deceptions.
While the 300 page paperback (at $ 25) is not yet available, the Kindle version at Amazon is yours for immediate download at $ 9.99. The Kindle reader is free and at this price you can not afford not to buy it.
It also provides 230 references.
The publisher 's note says: In The Deliberate Corruption of Climate Science, Dr. Tim Ball exposes the malicious misuse of climate science by dishonest brokers to advance the agenda of the progressive left. How was legitimate science twisted into a morass of convoluted gibberish? Dr. Ball explores how and why the science was distorted for political purposes.
Tim's recent post in WUWT deals with some of these aspects, but does not mention the book itself.
The 200 year cycle according to Abdussamatov
Dr. Habibullo Abdussamatov who heads Russia 's prestigious Pulkovo Observatory in St. Petersburg predicts that: after the maximum of solar Cycle-24, from approximately 2014, we can expect the start of the next bicentennial cycle of deep cooling with a Little Ice Age in 2055 plus or minus 11 years (the 19th to occur in the past 7,500 years).
Dr. Abdussamatov points out that Earth has experienced such occurrences five times over the last 1,000 years, and that: A global freeze will come about regardless of whether or not industrialized countries put a cap on their greenhouse gas emissions. The common view of Man 's industrial activity is a deciding factor in global warming has emerged from a misinterpretation of cause and effect.
The whole story is by Larry Bell (Forbes) published in GWPF
DeFreitas on the Pacific
Chris deFreitas is one of those who with McLean, Kosaka, Carter, Tisdale (item 2 on CliSci # 156), Trenberth and others point to the Pacific oscillations as key to weather patterns across the globe, which does not mean that they necessarily agree with each other. De Freitas and McLean 's work has been mentioned before (See CliSci # 143 of 10 September) in connection with the apparent four month delay of Global Mean Temperature (HadCRUt4) followwiing the ENSO index (SOI).
DeFreitas wrote this week in the Yahoo CS Forum: "Several recent works link climate variability to decadal-scale processes (esp. PDO, which is the longer-term ENSO pattern), such as McLean et al. (2009), Kosaka and Xie (2013) and de Freitas and McLean (2013). This variability is superimposed upon what appears to be the less potent carbon dioxide increase-effect on global temperature.
McLean et al (2009) were criticised for the statistical methods used. So, de Freitas and McLean (2013) reanalysed data without any statistical massaging. The results shows that ENSO accounted for a great deal of the variability in mean global temperature. The likely mechanism (as described) is enhanced (or reduced) Hadley circulation, which increases (or decreases) the effectiveness of meridional heat transfer from the vast tropical zone of surplus towards the poles. It could be that the same process causes vast amounts of stored ocean heat to be fed into the atmosphere over extended periods (or moved back into the ocean over lengthy periods) i. e. changes in meridional overturning contributes to movement of deep water into or out of the mixed surface layer. The result is planet-wide warming (or cooling). If this persists, we get decadal scale global warming (or cooling) trends."
References:
* de Freitas, C.R. and McLean, J.D., 2013. Update of the chronology of natural signals in the near-surface mean global temperature record and the Southern Oscillation Index. International Journal of Geosciences, 4(1), 234-239.http://www.scirp.org/journal/PaperInformation.aspx?paperID=27382&
* Kosaka Yu & Xie, Shang-Ping. 2013: Recent global-warming hiatus tied to equatorial
Pacific surface cooling. Nature, 501, 403 407. doi:10.1038/nature12534
* McLean, J. D., C. R. de Freitas, and R. M. Carter, 2009a. Influence of the Southern Oscillation on tropospheric temperature, Journal of Geophysical Research, 114, D14104, doi:10.1029/2008JD011637.
* McLean, J. D., C. R. de Freitas, and R. M. Carter, 2009b. Correction to Influence of the Southern Oscillation on tropospheric temperature ' ', Journal of Geophysical Research, 114, D20101, doi:10.1029/2009JD013006.
(reproduced w/permission)
Of course, the discussion will involve much more than that. While ENSO (the Ni ±o/Ni ±a events, of an irregular cyclic periodicity and connected to the Walker circulation) explains a lot, its connection to the regular ~60 year PDO cycle is uncertain. While few relate the ENSO system to solar variation, such a claim is more often made for the PDO, of which the ~30 year cold/warm alternations are well known. Svensmark-style cloud influence has been invoked for the Pacific system also.
As Don Easterbrook says: "What drives these oceanic/climatic cycles remains equivocal. Correlations with various solar parameters appear to be quite good, but the causal mechanism remains unclear".
All agree: CO2 it is not.....
-------------------
Reporting global temperature data
The question comes up regularly as to why temperature data are reported in "anomalies" from an adopted baseline, rather than in absolute form.
In a WUWT post, Bob Tisdale reports and discusses the answers given by NASA 's Goddard Institute for Space Studies (GISS), UK Met 's Hadley Centre and NOAA's National Climatic Data Center (NCDC).
He also reviews what has to be done to produce the various types of composite summaries that are so widely used.
........ and an admission
Incidentally, on January 21, 2014 Gavin A. Schmidt, Deputy Chief, NASA 's GISS and Thomas R. Karl, Director of NOAA 's NCDC jointly announced that their respective GISS and NCDC global temperature datasets both showed zero net global warming since 1997, and the UK Met Office confirmed that even the newly revised HadCRUT4 global temperature dataset showed zero net global warming since 1997.
So, 16 years of zero global warming contemporaneous with a 46% increase in gigatons of global CO2 emissions is now established as hard scientific fact.
(N.K.)
-------------------
Australia cyclones on a long decreasing trend
In a paper in Nature this week, Haig, Nott and Reichart report that Australian tropical cyclone activity is lower now than at any time over the past 550-1500 years (Mid-West and NE coasts). They developed an index based on 18O/16O ratios from stalagmites which reveals a repeated multi-centennial cycle of cyclone activity. The present cycle, which began around 1700 CE, includes a sharp decrease in activity in Western Australia after 1960.
~~~~~~~~~~~~~~~~~~~~~~~~~~~~~~~~~~~~~~~~
CliSci #156 2014-01-20
Europe to ditch IPCC Climate goals
The EU's reputation as the most committed supporter of IPCC 's policies and as a model of environmental responsibility may soon be history. The European Commission wants to forgo ambitious 'climate protection' goals and pave the way for fracking -- jeopardizing Germany 's touted energy revolution in the process.
Der Spiegel reports from EU headquarters that the member states will no longer get "guidelines" from Brussels on "climate protection" goals.
See also Die Welt 14-20/1 and GWPF 's CCNet 20/01/14.
Taking the wraps off the Southern Oscillation
Bob Tisdale, who specialises on Pacific Ocean events and their relationship to climate, writes a very patiently explained, mini treatise of the ENSO, El Ni ±o and La Ni ±a on WUWT, illustrated with simple drawings. Useful to acquire or refresh your knowledge of a system which has much to do with our weather, not only at the western side of our continent, but as far East as Monsoon territory.
Let it be noted that Bob does not discuss the PDO (which is not directly part of the SO system itself) nor any orbital/LOD relationships.
Donna Laframboise to address the UK Committee
As mentioned in CliSci #153, Donna was among the submitters of comments on AR5 to the British Commons Committee, mostly on matters dealing directly with the nature and practices of the IPCC.
She has now been asked to make herself available for further questioning by the Committee. She will go to London, but the Committee will not pay her way. She needs some donations. Donate through her website if you wish.
Things are really rocking in old Britain.
PM Cameron connects the bad weather with Global Warming and the MET office says he 's wrong(!)
There 'll be an end to electric subsidies in the foreseeable future. More shale gas, says the government. Alternative contributes only 3% of energy anyway.
The "Greens" at the BBC have been exposed and defrocked as the Mail 's David Rose writes (12/1) about a secret AGW propaganda training eco-seminar.
Head scratching now taking place: see next item.
The BBC and the Sun
And only a week later, BBC WorldNews as well as its website produce a piece by Rebecca Morelle which quotes two UK solar physicists (Professors Richard Harrison and Lucie Green) about how surprised they are about the rapidly decreasing activity of the sun.
Your editor can only be surprised in turn that two academic solar scientists are apparently unaware of the work by Scafetta, Niroma, Solanki, DeJager, Duhau, Charvatova, Usoskin, Willson and so many others.
At least U.Reading's Mike Lockwood puts in a word for solar minima and a decrease in total radiation.
Lucie Green is worrying about the displays of Northern Lights.
Read this release, if only in terms of the Mother Corporation's intestinal discomfort.
Trenberth: PDO is what 's done it
Walter Stark:
"The increasingly complex intellectual contortions of the warmists in trying to maintain the sacred CO2 Greenhouse at the centre of their universe is reminiscent of the elaboration of epicycles constructed to maintain the geocentric theory."
What he 's talking about is an article by old IPCC hand Ken Trenberth who is connecting the well known positive/negative PDO cycle to the "hidden heat" in the oceans.
Abstract: Global warming first became evident beyond the bounds of natural variability in the 1970s, but increases in global mean surface temperatures have stalled in the 2000s. Increases in atmospheric greenhouse gases, notably carbon dioxide, create an energy imbalance at the top-of-atmosphere (TOA) even as the planet warms to adjust to this imbalance, which is estimated to be 0.5 1 W m ˆ’2 over the 2000s. Annual global fluctuations in TOA energy of up to 0.2 W m ˆ’2 occur from natural variations in clouds, aerosols, and changes in the Sun. At times of major volcanic eruptions the effects can be much larger. Yet global mean surface temperatures fluctuate much more than these can account for. An energy imbalance is manifested not just as surface atmospheric or ground warming but also as melting sea and land ice, and heating of the oceans. More than 90% of the heat goes into the oceans and, with melting land ice, causes sea level to rise. For the past decade, more than 30% of the heat has apparently penetrated below 700 m depth that is traceable to changes in surface winds mainly over the Pacific in association with a switch to a negative phase of the Pacific Decadal Oscillation (PDO) in 1999. Surface warming was much more in evidence during the 1976 1998 positive phase of the PDO, suggesting that natural decadal variability modulates the rate of change of global surface temperatures while sea-level rise is more relentless. Global warming has not stopped; it is merely manifested in different ways.
So, Ken Trenberth is still looking for "The missing Heat"
It begs the question what influences the major PDO/NAO oscillations.
In the last paragraphs of his "Conclusions" he is putting the cart firmly in front of the horse.
WUWT comments HERE
Milankovitch version 2
Clive Best has on his blog and on WUWT two companion pieces.
According to him, Supertides caused by maxima in orbital eccentricity affect the predominance of one or the other of Milankovitch ' cycles. The most exceptional tides occur when the perihelion of the sun and the moon coincide and both orbits are at maximum eccentricity. This process can explain both the origin of the 100,000 year cycle of ice ages and the transition from earlier 41,000 year glaciation cycles which have so far remained a mystery.
He proposes a hypothesis as follows:
* 5 million years ago a gradual cooling of the climate began. This was most likely due to plate tectonics. First Antarctica moved further south to sit over the South Pole isolating the Southern Ocean. Second the Panama isthmus closed cutting off circulation between the Atlantic and Pacific.
* A regular glacial cycle began driven by the 41,000 year change in obliquity of the earth 's axis. Higher obliquity brings higher insolation to both poles modulated by the precession of equinoxes. The 41,000 year signal dominates glaciation cycles from 5 million years ago until 1 million years ago. Meanwhile the intensity of glacial periods was slowly increasing as global cooling due to plate tectonics continued.
* 900,000 years ago this general cooling reached a critical stage because the increase in spread of ice sheets in the Northern hemisphere became too large to fully melt back during the next peak in obliquity. The cycle of 41,000 year ice ages was broken.
* Something else was now needed to trigger ice ages and that something was extreme tidal forces caused by maximum orbital eccentricity. When these coincided with peak insolation in the Arctic Circle the breakup of the northern ice sheets could begin and they collapsed rapidly within one precession cycle.
The aspect of the Moon 's influence is emphasised in the piece on Clive's own blog.
"Pattern Recognition in Physics" exeunt
The promising initiative that PRP represented (Special Issue on 'Planetary-solar-terrestrial interaction'- See last item CliSci # 154), publishing 12 innovative papers, possibly not all of "research quality", has been rumoured to have been destroyed by the mob.
See some violent reactions particularly on the JoNova blog and discussion on WUWT, where Anthony disagrees with the authors, but regrets the shut-down in principle.
More recent information seems that the main objection to the Special Issue was one of "Pal-Review". See HERE .
--------------
WUWT 's reference pages
The introduction of a new "Northern Polar Vortex" Page in the series of Reference Pages on WUWT provides a mini-seminar on polar vortices in general and a look at the full complement of reference pages the site maintains.
A nod to possible geomagnetic involvement (solar wind parameter) is made with reference to a paper by Bucha in Studia Geophysics & Geodetica (pay-walled, Abstract only)
~~~~~~~~~~~~~~~~~~~~~~~~~~~~~~~~~~~~~~~~
CliSci # 155 2014-01-10
NASA shows the sun 's Polar Flip
Try this half minute video to watch the process of the sun changing its polarity.
<https://www.youtube.com/watch?feature=player_embedded&v=B4UtVo7-yJA>
This video runs from the beginning of cycle 24 in ~September 2009 to the present day, with the approximate reversal occurring around the relative maximum of the cycle last August 2013.
See also HERE for some discussion.
Second thoughts at the British Antarctic Survey
An article in the Register begins: "Scientists at the British Antarctic Survey say that the melting of the Pine Island Glacier ice shelf in Antarctica has suddenly slowed right down in the last few years, confirming earlier research which suggested that the shelf's melt does not result from human-driven global warming."
Dr Pierre Dutrieux of the BAS adds, bluntly:
"We found ocean melting of the glacier was the lowest ever recorded, and less than half of that observed in 2010. This enormous, and unexpected, variability contradicts the widespread view that a simple and steady ocean warming in the region is eroding the West Antarctic Ice Sheet."
Some evidence on cooling
The justthefactswuwt Department of Anthony Watts ' blogsite posted a series of graphs supplying evidence on multiple expressions of "standstill" and cooling.
Charts include: Global temperature (HadCRUt, GISS, RSS, UAH), Arctic ice cover (Cryosat 2010 through 2013), Same on detail of the current winter (NSIDC, both on Arctic and Antarctic), Northern Sea Ice anomaly and SH Sea Ice Anomaly and Global Sea Ice (U.Illinois, 1979-2014), Southern Ocean SST anomaly (Tisdale), NH Snow extent through the seasons (Rutgers U), Global Tropical Cyclones and Major Hurricanes (1970-2014, - Ryan Maue), several US tornado/hurricane graphs, blizzards, precipitation, humidity.
At the end the compilers ask:
"Can anyone cite a CAGW prediction that was accurate in 2013?"
The Northern "Polar Vortex"
Another justthefacts contribution refers to the present day cold outbursts in Eastern North America and elsewhere. What is happening on top of the world is a fight between a pair of concentrated pressure anomalies, with, as usual, the "high" flowing to the "low" with a Coriolis deviation to the right, which directs the blasts Southward. This system is said to be generated by the earth ' rotation. When strong, it upsets the zonal flow of the Jetstream and the boundary between the Ferrell and Hadley tropospheric circulation cells. The late Marcel Leroux used to call these outbursts of the "Mobile Polar High", but a series of charts in WUWT would seem to give a better picture of their dual nature. In fact it is the cyclonic Low, when located over the rotational pole, that seems to set things off. It can have different meteorologic outcomes in different configurations, vertically as well as horizontally.
The post is meteorologically descriptive; it does not discuss the origin of the polar behaviour or any relationship with predicting cooling.
You should scroll down on the above hyperlink to a post on January 8th at 4:27 a.m. to see the comment by "TB", a gentleman with more meteo knowledge than your present author, and who some of you may recognise.
John Holdren, the ex-Harvard Professor of Environmental Policy who Obama appointed as his "Senior Science Advisor", is reported saying that "Polar Vortex cold likely linked to man made climate change". Professor Judith Curry has little time for the nonsense of the "Science Czar" and writes "In a word, No", and then enlarges on her opinion.
Holdren has a long history of fighting AGW sceptics, not to speak of some other dark moment in his history, challenged but not disproven. Some people may recall his role in hounding astrophysicist Sallie Baliunas out of Harvard for daring to publish papers (with Willie Soon) fingering the sun as a major influence in climate change.
2013 harvest of solar-related papers
The Hockey Schtick publishes reasons to dismiss John Cook 's assertion of 97% scientific support for CAGW and follows up by listing 71 published papers (with abstracts) that deal with solar-related causes of climate change, courtesy of the UK-based "Club du Soleil".
A solar amplification mechanism
Frederick & Hodge 's paper in Atmospheric Chemistry and Physics describe an amplification mechanism of the smallish solar radiation variance with emphasis on the influence of cloudiness and on identifying systematic trends and possible links to the solar cycle. The HockeySchtick says that the study finds solar amplification mechanism via clouds at the South Pole, amplifies surface solar irradiance up to 24 times.
The IPCC has always maintained that changes in solar irradiance are insufficient to affect changes in climate.
~~~~~~~~~~~~~~~~~~~~~~~~~~~~~~~~~~~~~~~~